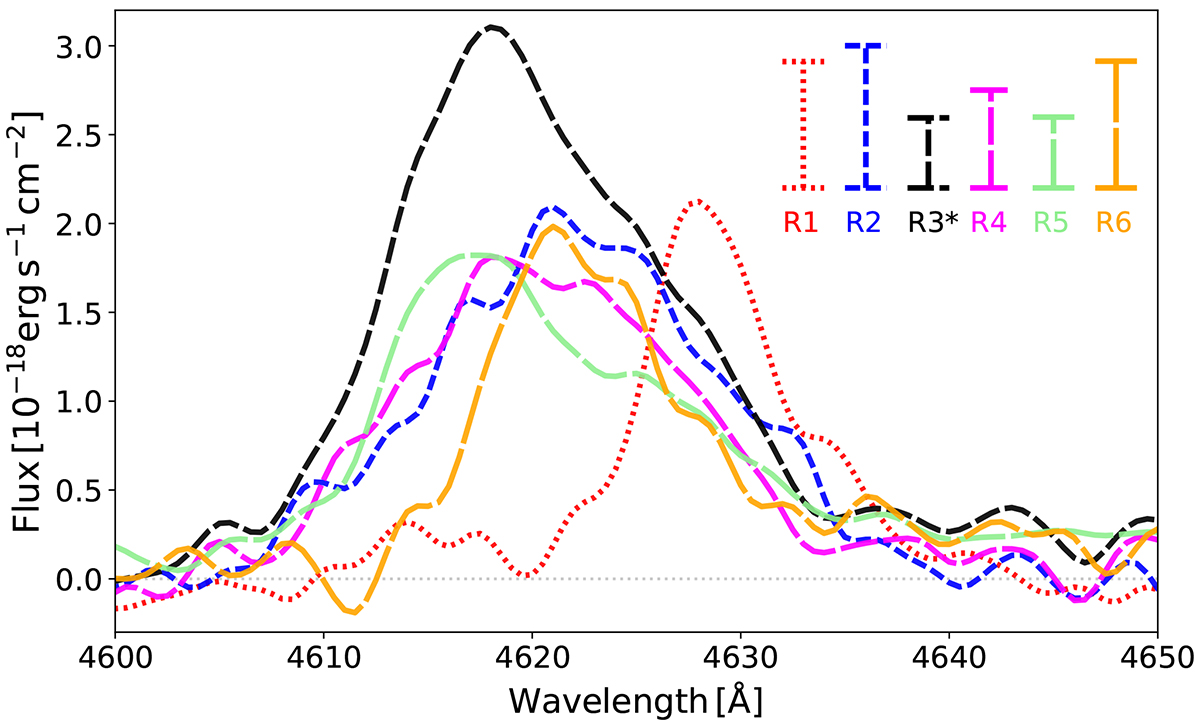
Fig. 8.
Download original image
Lyα spectra for each of the regions in Fig. 6, showing flux as a function of wavelength. We normalized R3 by a factor of 3.5 to fit within the plot. The spectra were extracted from the original datacube (without AKS), but we applied a Gaussian smoothing of 2 pixels for visualization purposes. The error bars in the top-right corner represent 2σ for each region, estimated from wavelength ranges excluding the emission line (4600 − 4650 Å).
Current usage metrics show cumulative count of Article Views (full-text article views including HTML views, PDF and ePub downloads, according to the available data) and Abstracts Views on Vision4Press platform.
Data correspond to usage on the plateform after 2015. The current usage metrics is available 48-96 hours after online publication and is updated daily on week days.
Initial download of the metrics may take a while.