Fig. 7.
Download original image
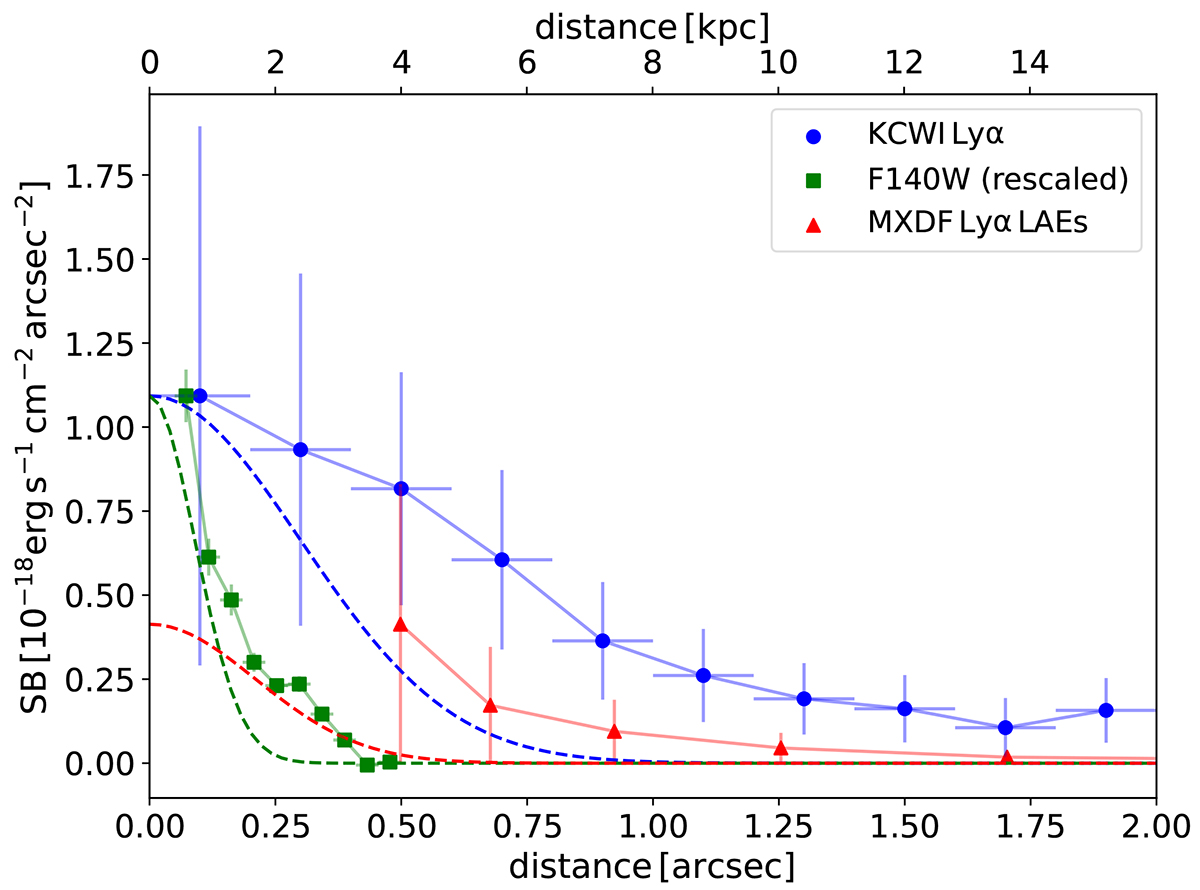
SB radial profile centered on the peak of the Lyα emission found to the southwest of the quasar, corresponding to a LAE in region R1 (see Fig. 6). The blue circles represent the radial profile extracted from the KCWI data. The green squares correspond to the HST F140W profile, which has been rescaled to match the Lyα profile to aid visual comparisons and highlight the stellar component associated with the source. The red triangles show the mean SB profile of LAEs from the MXDF MUSE field (Guo et al. 2024), providing a comparison between the emission profile of region R1 and a typical LAE environment. This comparison emphasizes the enhanced SB of the Lyα halo in region R1 relative to the average LAE population, potentially suggesting additional contributions from the CGM or interactions with the quasar’s environment.
Current usage metrics show cumulative count of Article Views (full-text article views including HTML views, PDF and ePub downloads, according to the available data) and Abstracts Views on Vision4Press platform.
Data correspond to usage on the plateform after 2015. The current usage metrics is available 48-96 hours after online publication and is updated daily on week days.
Initial download of the metrics may take a while.