Fig. 6.
Download original image
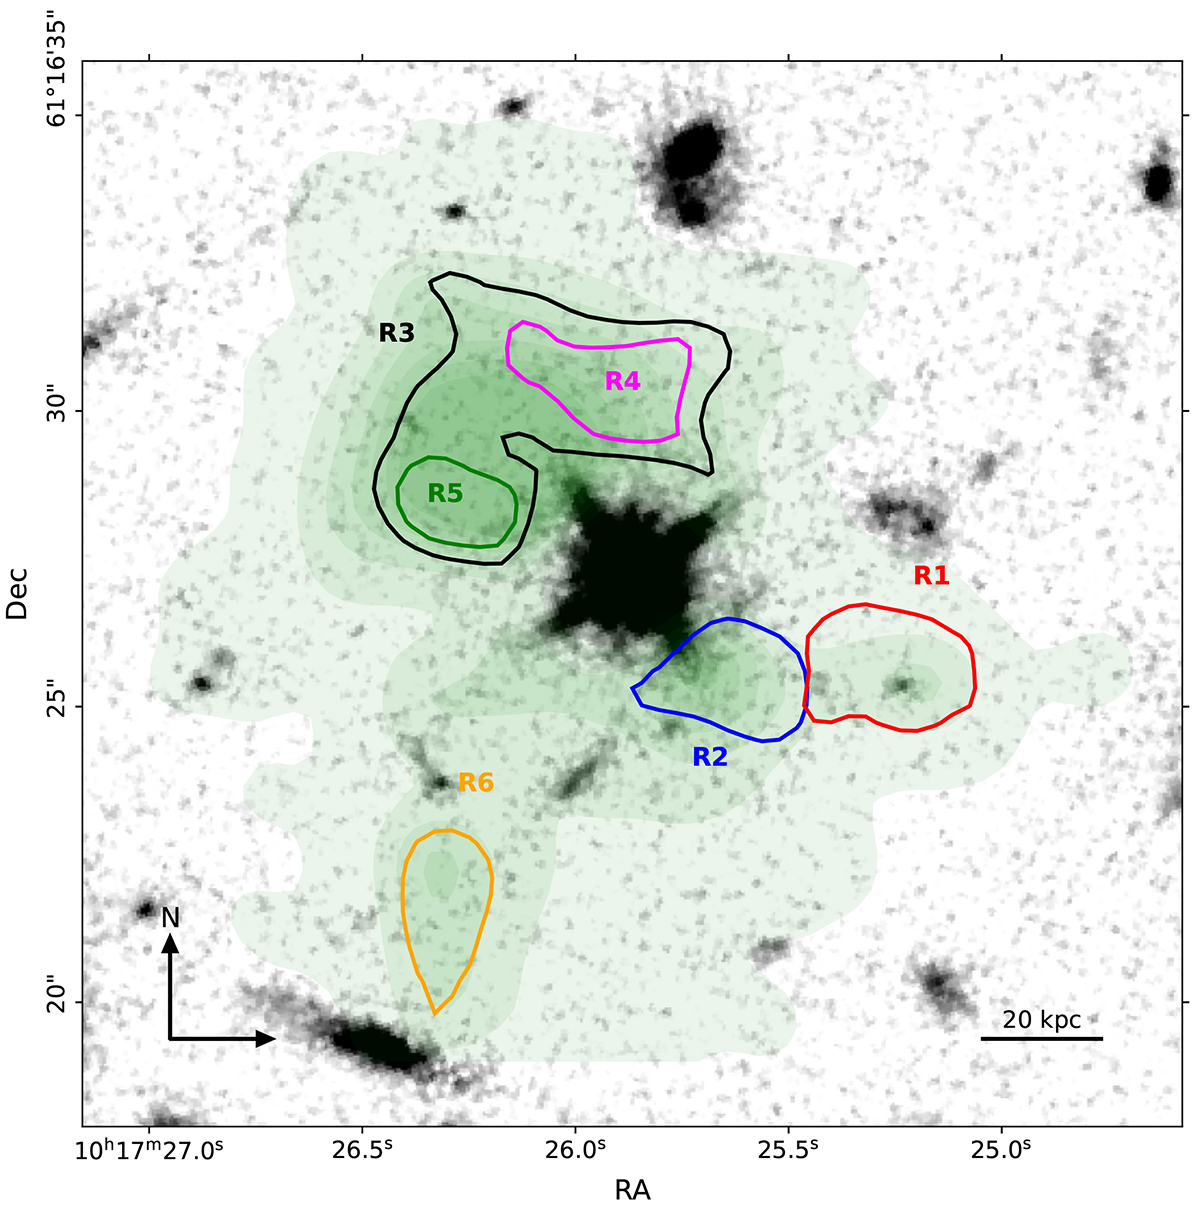
HST F140W image of the area surrounding the Lyα halo, with SB green contours representing Lyα emission levels overlaid. The contours, smoothed using a Gaussian filter of 3 pixels, highlight the extent of the emission. We defined six distinct regions (R1 to R6) based on their kinematic and morphological properties and applying the same Gaussian smoothing. Region R1 (red), characterized by a high velocity offset (exceeding 400 km s−1), is interpreted as an independent halo associated with a continuum source. Regions R2 to R6 are defined by contours of the FWHM image, with R2 (blue) corresponding to FWHM values above 700 km s−1, R3 (black) above 800 km s−1, R4 (magenta) and R5 (green) above 900 km s−1, and R6 (gold) above 500 km s−1.
Current usage metrics show cumulative count of Article Views (full-text article views including HTML views, PDF and ePub downloads, according to the available data) and Abstracts Views on Vision4Press platform.
Data correspond to usage on the plateform after 2015. The current usage metrics is available 48-96 hours after online publication and is updated daily on week days.
Initial download of the metrics may take a while.