Fig. 5.
Download original image
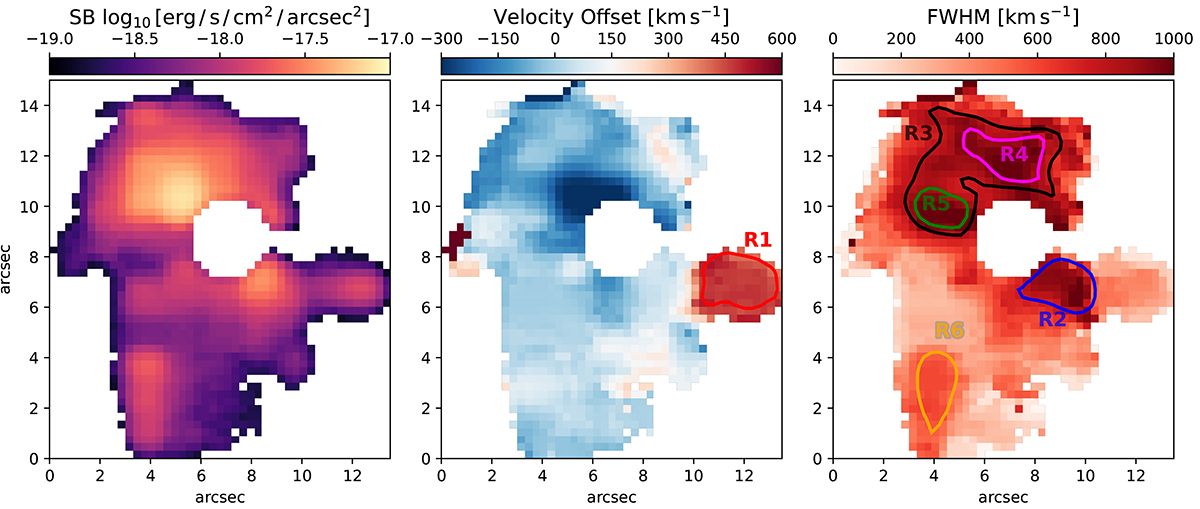
LAE halo detected in the KCWI datacube. The panels correspond to the first three moment maps of the extended emission: SB, flux-weighted centroid with respect to the mean velocity, and the FWHM of the spectral line. The emission was extracted from the datacube using the AKS technique, which is specifically designed to separate extended emission with low SB from the background noise. Region R1, identified based on the velocity offset map (center panel), corresponds to a redshifted structure with a velocity offset exceeding 400 km s−1. Regions R2 to R6, defined from the FWHM map (right panel), correspond to areas with broad Lyα emission: R2 includes FWHM values above 700 km s−1, R3 above 800 km s−1, R4 and R5 above 900 km s−1, and R6 above 500 km s−1. A supplementary figure in the appendix provides an unsmoothed visualization of the moments (Fig. A.1), along with the S/N and the number of voxels per pixel within the segmentation mask for reference (Fig. A.2).
Current usage metrics show cumulative count of Article Views (full-text article views including HTML views, PDF and ePub downloads, according to the available data) and Abstracts Views on Vision4Press platform.
Data correspond to usage on the plateform after 2015. The current usage metrics is available 48-96 hours after online publication and is updated daily on week days.
Initial download of the metrics may take a while.