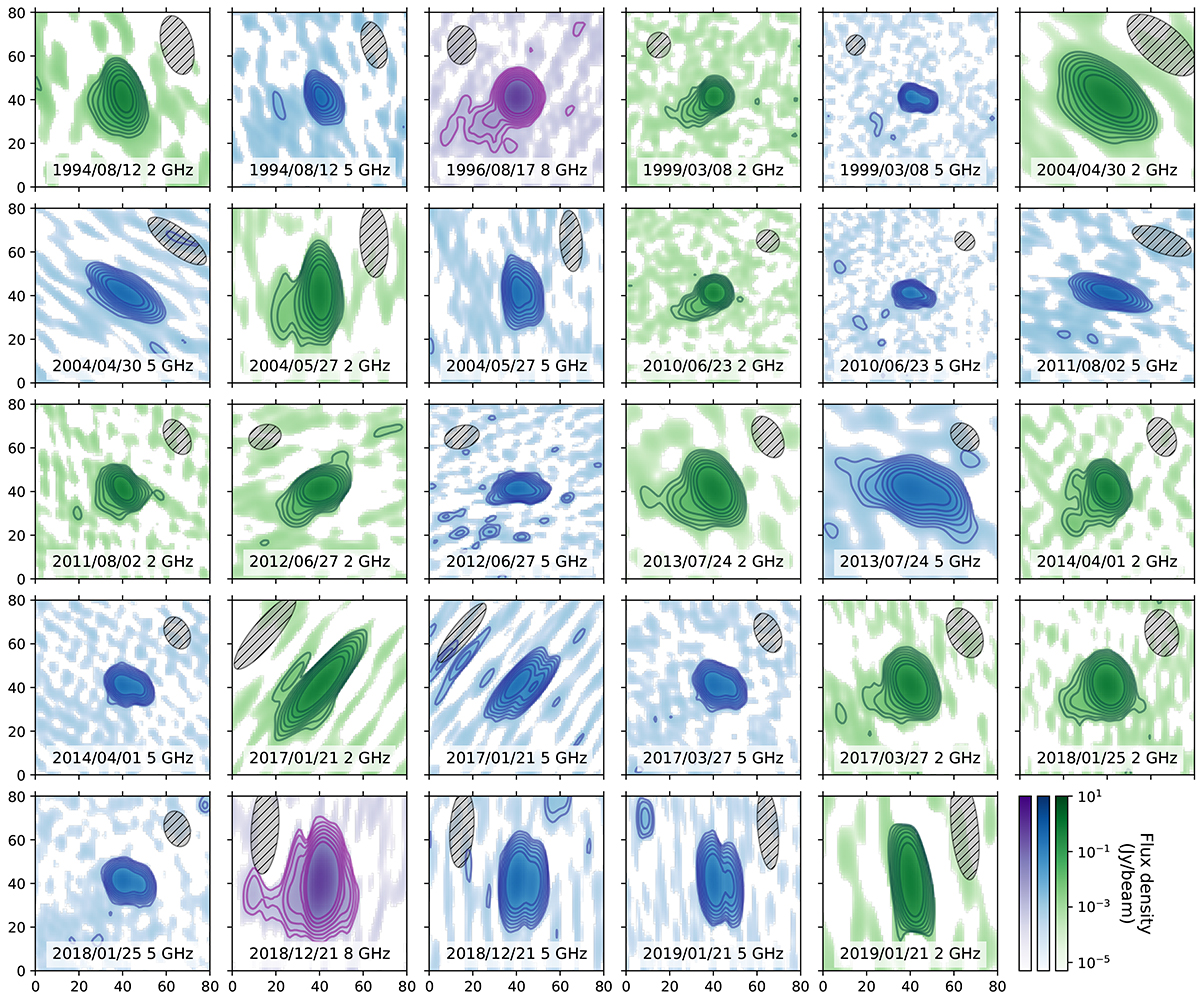
Fig. A.3.
Download original image
VLBI images of J1017+6116 observed at various dates and frequencies: S band (2 GHz), X band (5 GHz), and C band (8 GHz), as labeled. The axis units are milliarcseconds to give the spatial extension of the regions. The grayscale ellipses represent the estimated PSF. The dark green, blue, and magenta contour lines indicate specific flux density levels for the S, X, and C bands, calculated as multiples of the standard deviation (3 × [1, 2, 4, 8, 16, 32, 64]) above the mean background level.
Current usage metrics show cumulative count of Article Views (full-text article views including HTML views, PDF and ePub downloads, according to the available data) and Abstracts Views on Vision4Press platform.
Data correspond to usage on the plateform after 2015. The current usage metrics is available 48-96 hours after online publication and is updated daily on week days.
Initial download of the metrics may take a while.