Fig. 4
Download original image
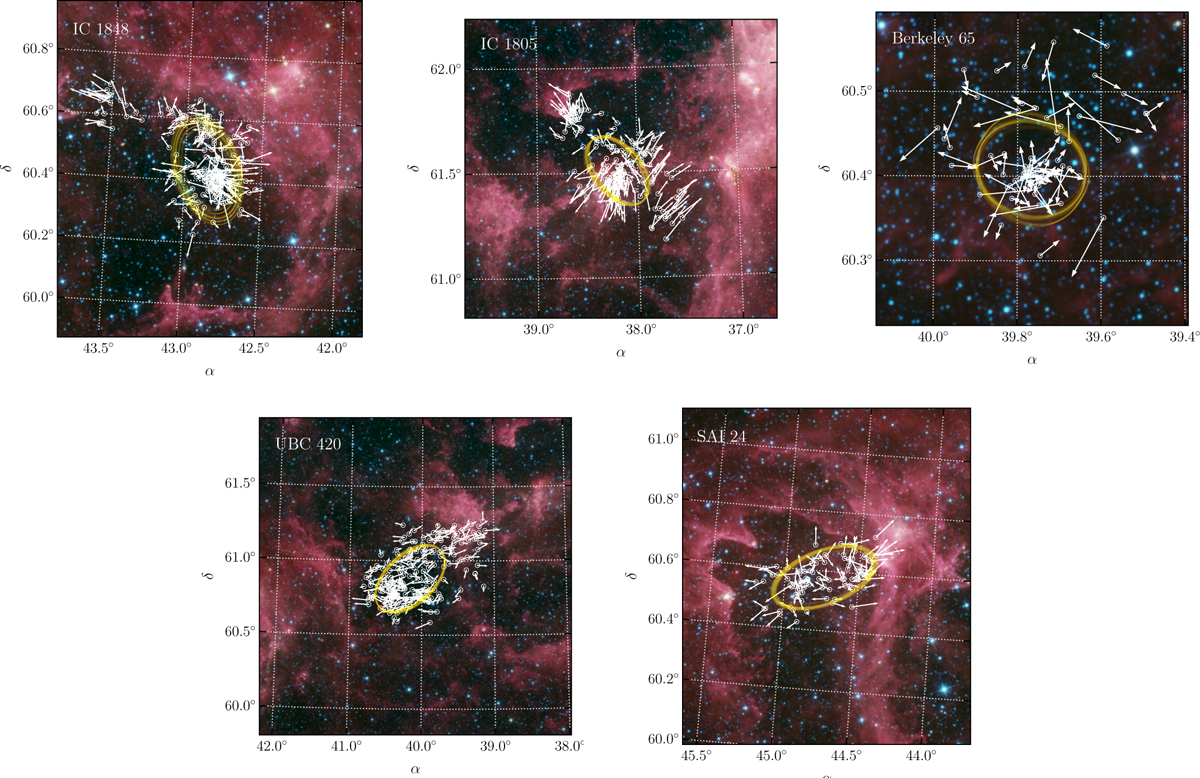
On-sky spatial distribution of cluster members. For each cluster star, PM vectors are shown overplotted on the RGB image of the region from the allWISE survey. We mapped the W3 band in red, W2 in green, and W1 in blue. The W3 filter mainly traces small grain dust and polycyclic aromatic hydrocarbon emissions, whereas the W1 and W2 filters are dominated by young stars (Wright et al. 2010). The best-fit ellipses of the spatial distributions are shown in gold.
Current usage metrics show cumulative count of Article Views (full-text article views including HTML views, PDF and ePub downloads, according to the available data) and Abstracts Views on Vision4Press platform.
Data correspond to usage on the plateform after 2015. The current usage metrics is available 48-96 hours after online publication and is updated daily on week days.
Initial download of the metrics may take a while.