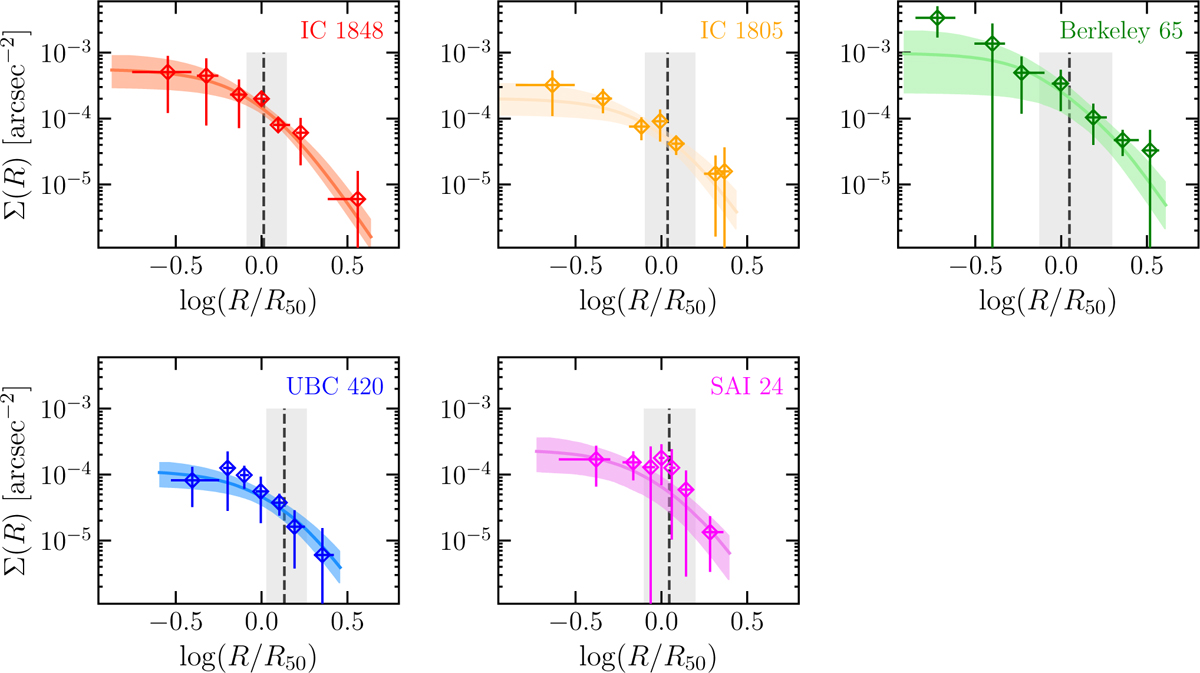
Fig. 3
Download original image
Projected number density profiles for the five clusters analyzed in this study. Distances from the center were normalized to R50. Errors in each evenly populated bin were computed as the standard deviation of density measurements in different angular sectors (on the y-axis) and as the quantiles of the radial distribution within the bin (on the x-axis). The solid lines show the median Plummer model fit of the profile, whereas the shaded areas show the 68% (i.e., 1σ) confidence interval. Finally, the dashed black lines (the gray shaded areas) show the median Plummer scale radius (68% confidence interval) from the marginalized posterior distributions.
Current usage metrics show cumulative count of Article Views (full-text article views including HTML views, PDF and ePub downloads, according to the available data) and Abstracts Views on Vision4Press platform.
Data correspond to usage on the plateform after 2015. The current usage metrics is available 48-96 hours after online publication and is updated daily on week days.
Initial download of the metrics may take a while.