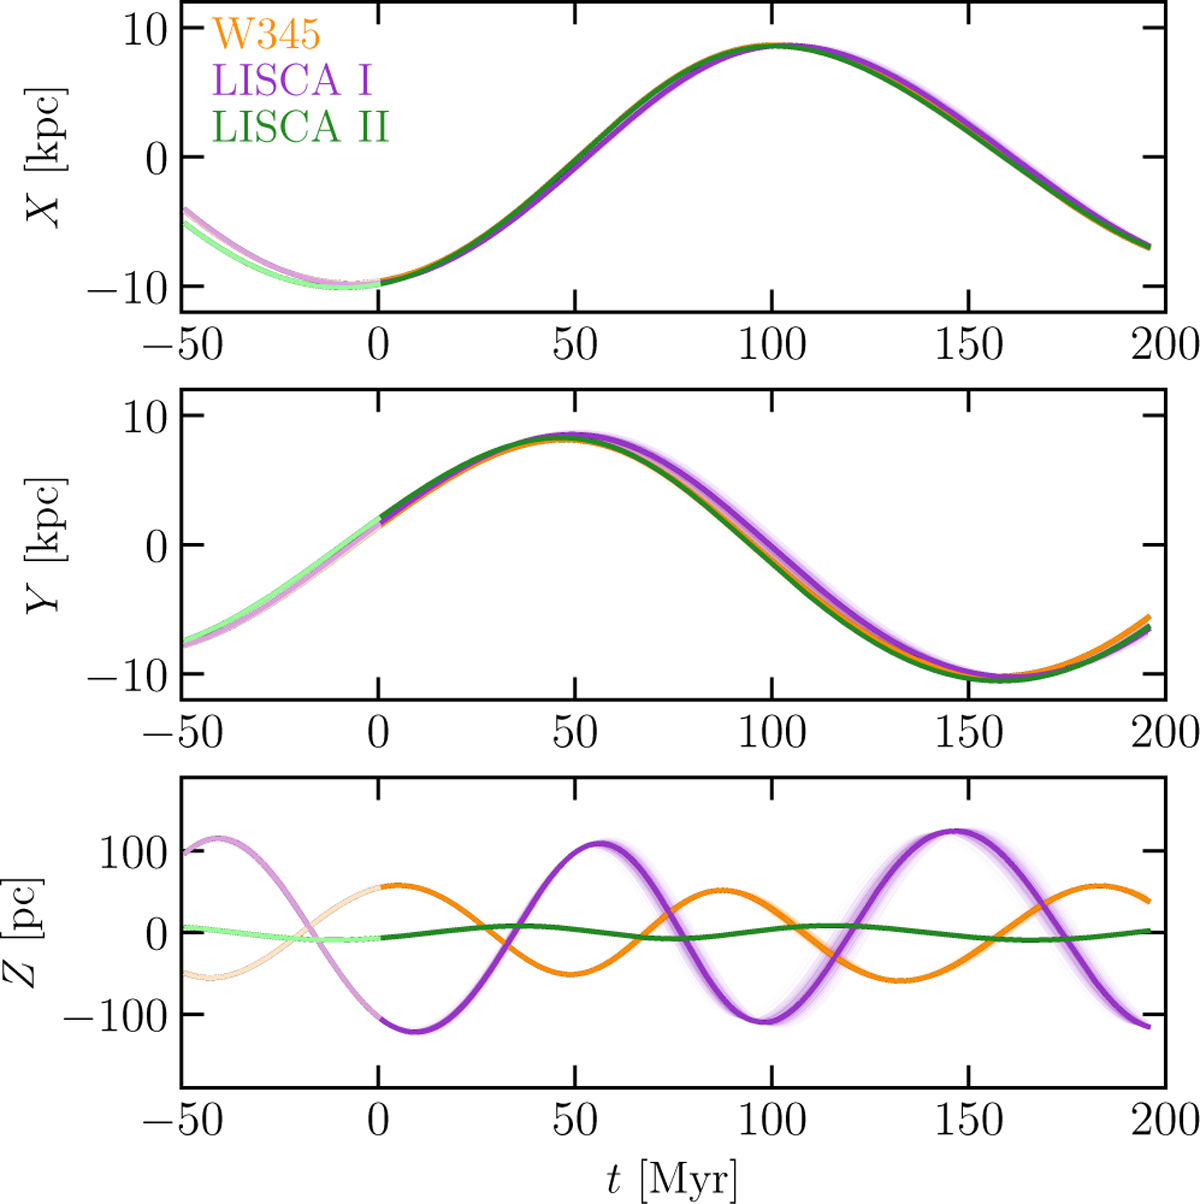
Fig. B.3
Download original image
Galactocentric coordinate time evolution for the three stellar aggregates studied in this work. Orbits were computed within the potential model including the Galactic bar. The thin lines show the different integrations from the error distribution sampling of the initial conditions, while the thicker lines are the median position at any given time.
Current usage metrics show cumulative count of Article Views (full-text article views including HTML views, PDF and ePub downloads, according to the available data) and Abstracts Views on Vision4Press platform.
Data correspond to usage on the plateform after 2015. The current usage metrics is available 48-96 hours after online publication and is updated daily on week days.
Initial download of the metrics may take a while.