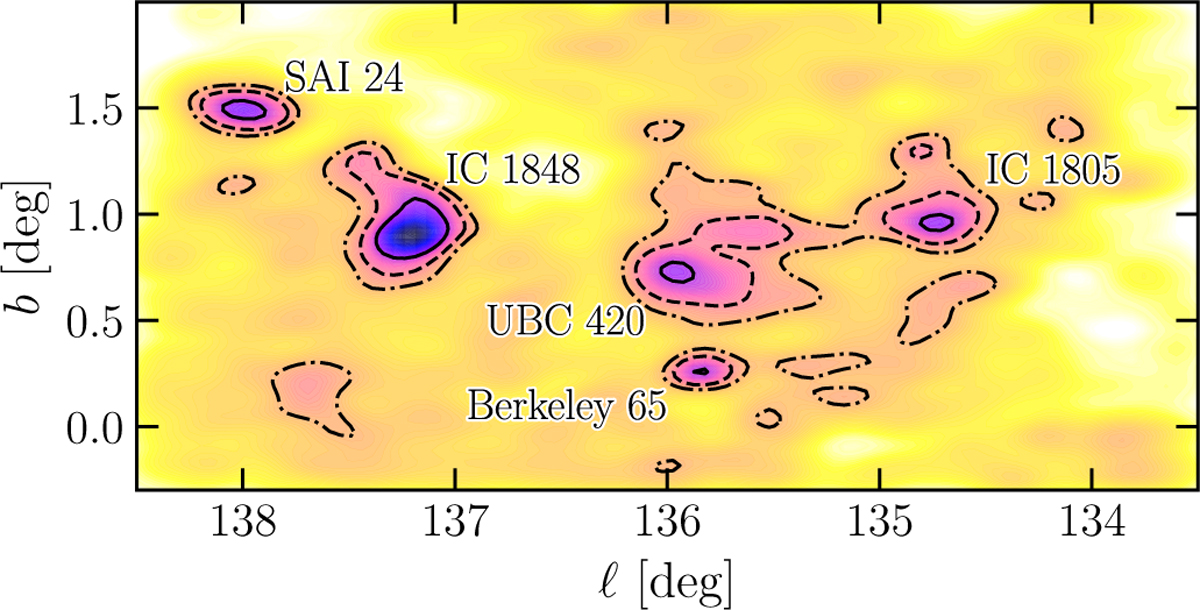
Fig. 2

Download original image
Two-dimensional density map in Galactic coordinates of Gaia sources after the parallax and PM selections. The darker colors indicate denser regions. Iso-density contours at 0.5σ (solid), 1σ (dashed), and 1.5σ (dash-dotted) are shown in black. The cluster positions and names are marked. The density map was obtained through Gaussian kernel density estimate using the gaussian_kde function of the scipy Python package (Virtanen et al. 2020).
Current usage metrics show cumulative count of Article Views (full-text article views including HTML views, PDF and ePub downloads, according to the available data) and Abstracts Views on Vision4Press platform.
Data correspond to usage on the plateform after 2015. The current usage metrics is available 48-96 hours after online publication and is updated daily on week days.
Initial download of the metrics may take a while.


