Fig. A.1
Download original image
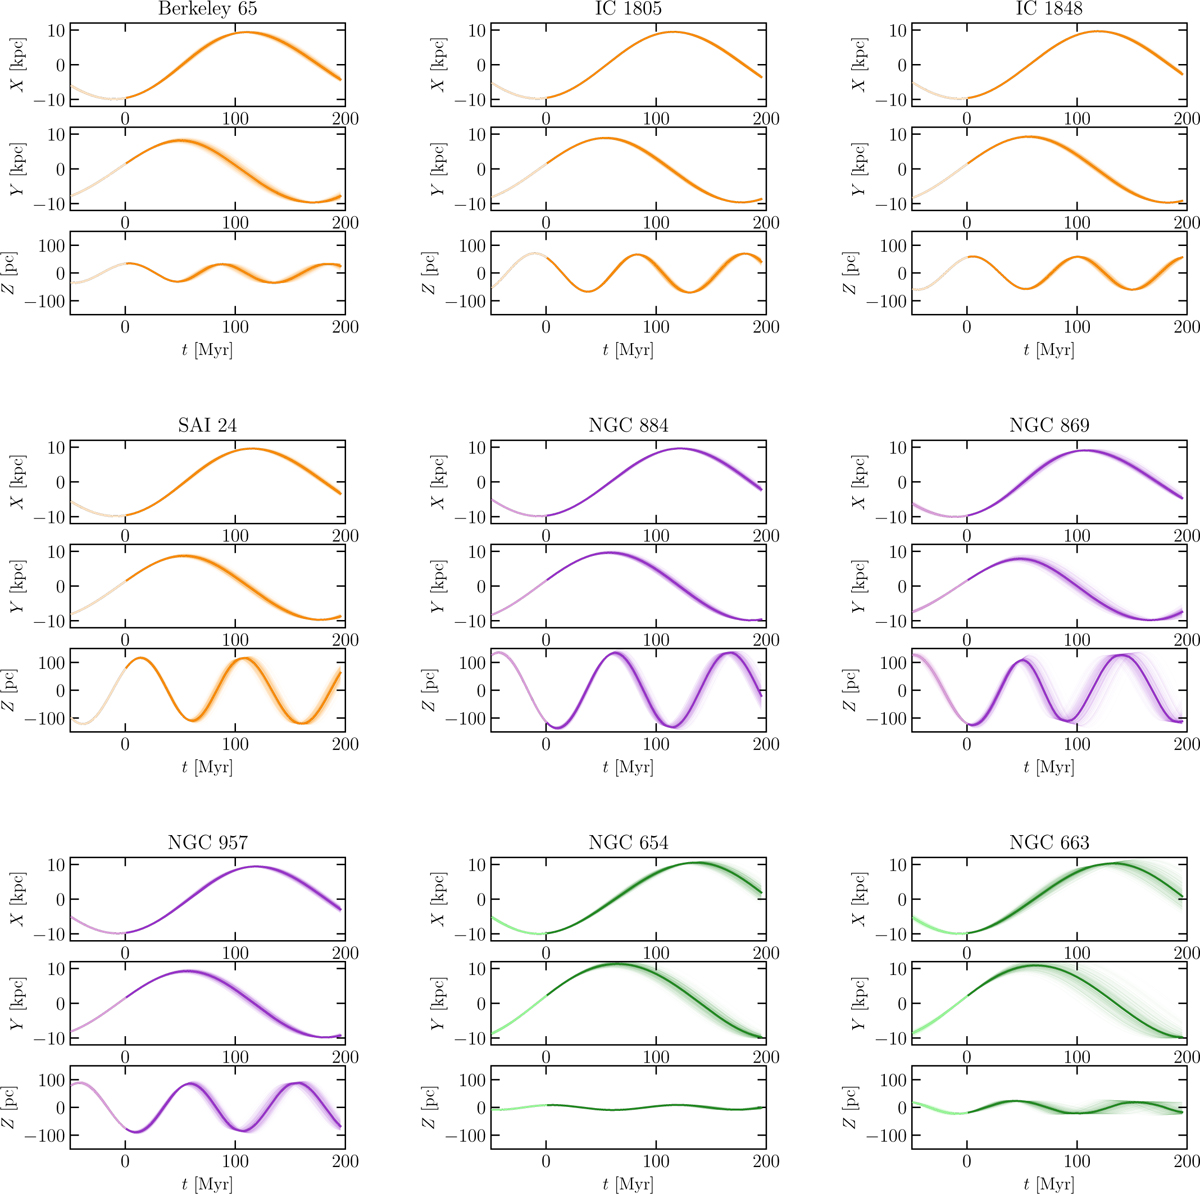
Temporal evolution of XYZ galactocentric coordinates for the 15 star clusters in the Perseus complex. Temporal evolution for 500 orbit integrations is shown with background thin lines. The initial conditions were extracted according to the distance and uLOS error distributions. The thicker foreground lines depict the median over multiple integrations. Cluster orbits are color-coded according to the larger cluster agglomerate to which they belong: orange for W345 complex, purple for LISCA I, and green for LISCA II.
Current usage metrics show cumulative count of Article Views (full-text article views including HTML views, PDF and ePub downloads, according to the available data) and Abstracts Views on Vision4Press platform.
Data correspond to usage on the plateform after 2015. The current usage metrics is available 48-96 hours after online publication and is updated daily on week days.
Initial download of the metrics may take a while.