Fig. 14
Download original image
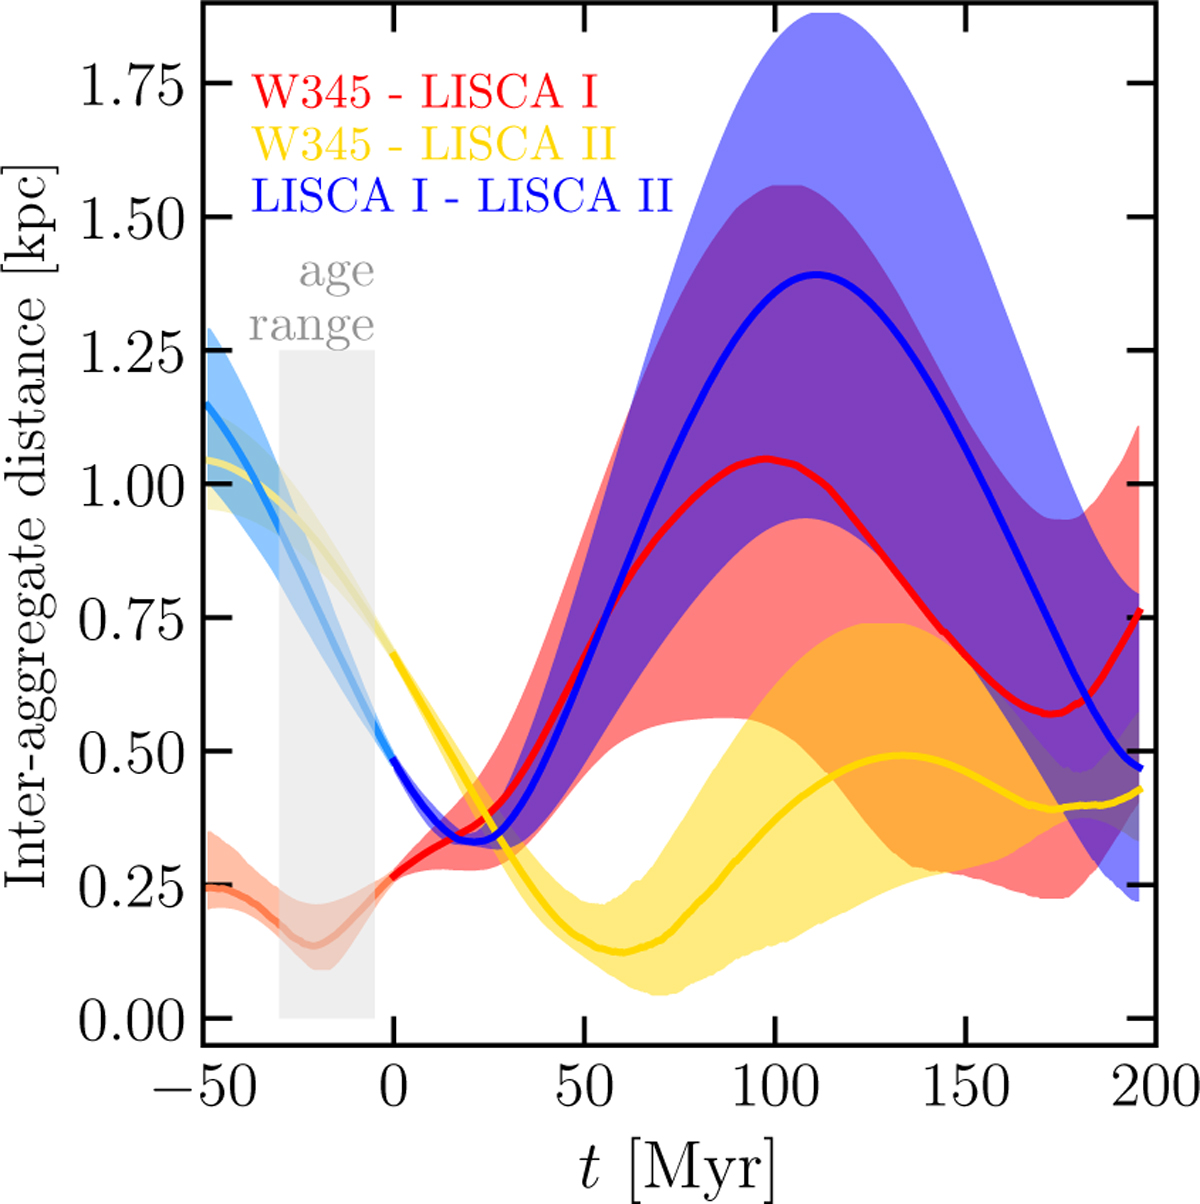
Time evolution of all combinations of inter-aggregate 3D distances. Darker colors trace the forward integration (t > 0), while lighter colors are for the backward integration. Median distances are shown as solid lines, with shaded areas being the 16th (lower distance) and 84th (upper distance) percentiles of the 3D distance distributions from multiple initial condition extractions. The vertical gray area delimits the stellar age ranges, from 5 Myr (for W345 complex star clusters) to about 30 Myr for LISCA II (see Della Croce et al. 2023).
Current usage metrics show cumulative count of Article Views (full-text article views including HTML views, PDF and ePub downloads, according to the available data) and Abstracts Views on Vision4Press platform.
Data correspond to usage on the plateform after 2015. The current usage metrics is available 48-96 hours after online publication and is updated daily on week days.
Initial download of the metrics may take a while.