Fig. 13
Download original image
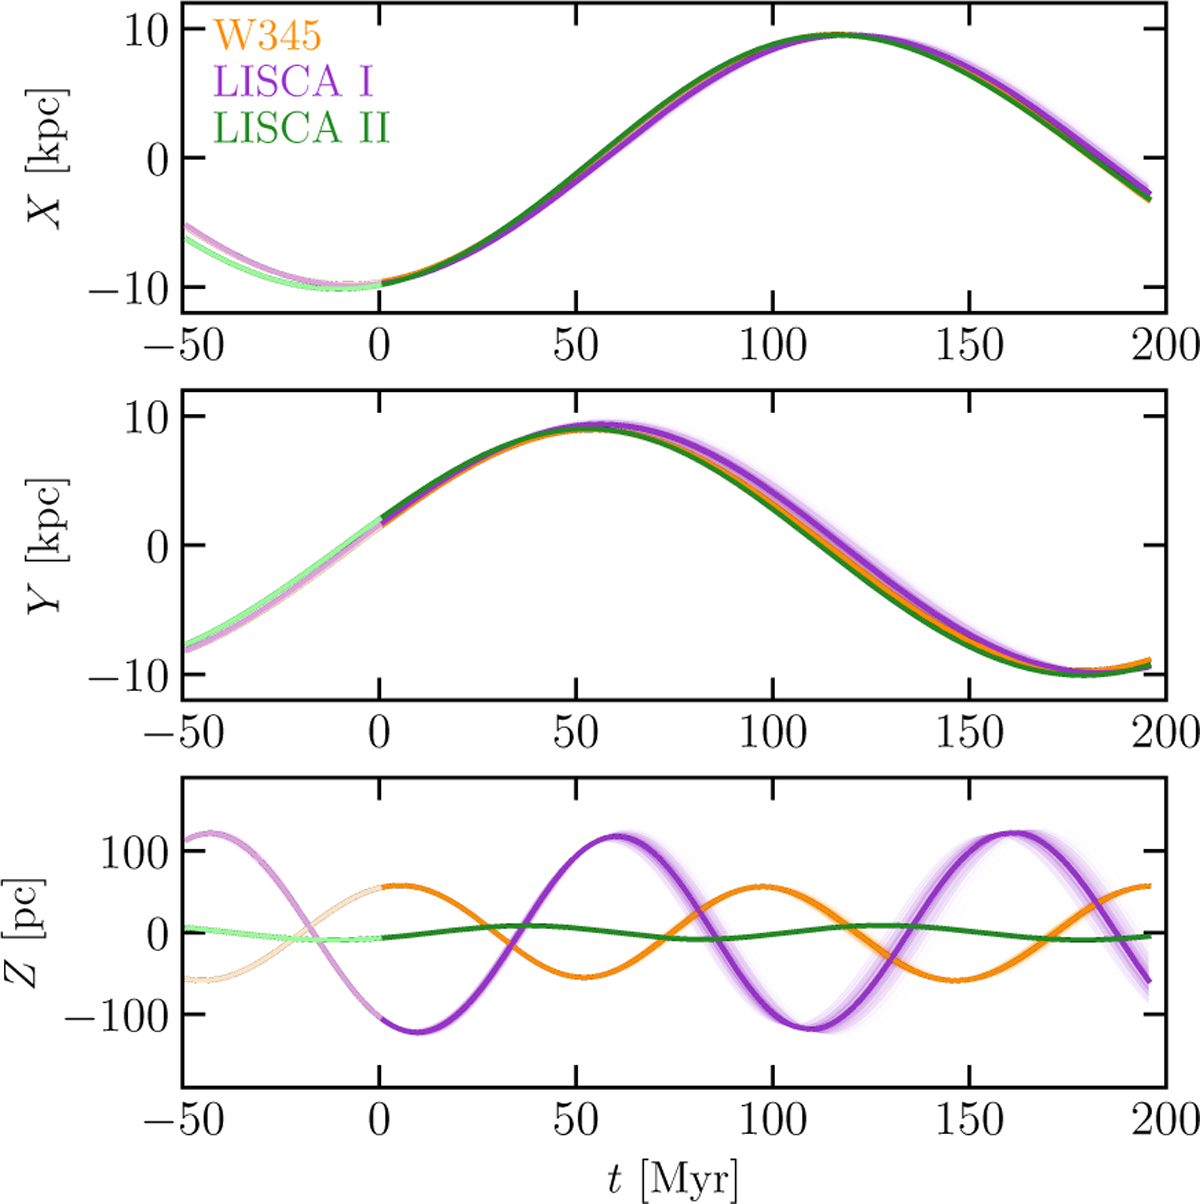
Galactocentric coordinate time evolution for the star cluster aggregates. Darker lines are for integrations forward in time (i.e., t > 0), while lighter lines are for backward integrations (i.e., t < 0). The present-day positions are at t = 0. Initial conditions were sampled 500 times to account for errors in the mean distance and vLOS, and are shown by thin lines. The thicker solid lines are the median (of those multiple extractions) orbits.
Current usage metrics show cumulative count of Article Views (full-text article views including HTML views, PDF and ePub downloads, according to the available data) and Abstracts Views on Vision4Press platform.
Data correspond to usage on the plateform after 2015. The current usage metrics is available 48-96 hours after online publication and is updated daily on week days.
Initial download of the metrics may take a while.