Fig. 12
Download original image
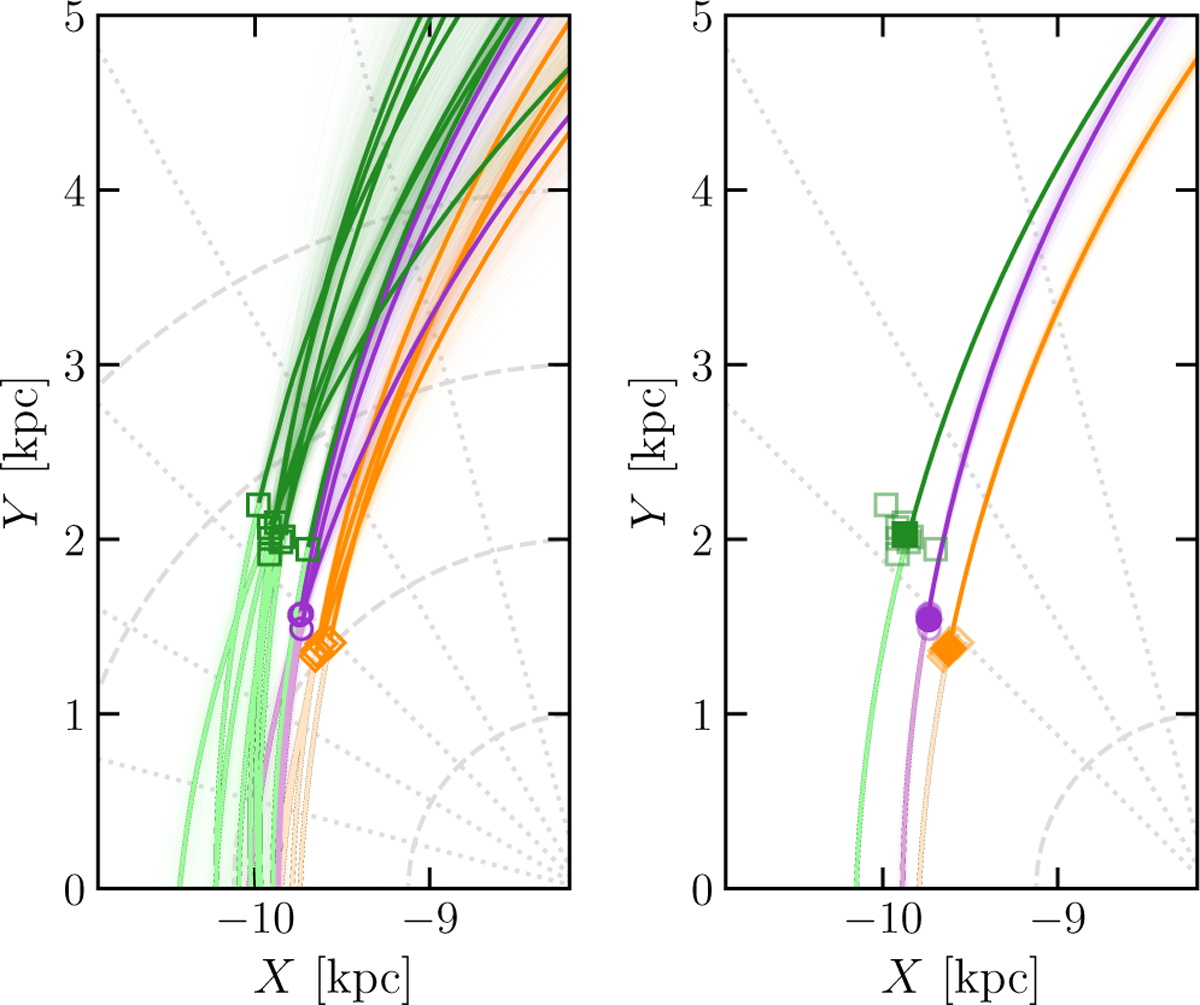
XY projection for individual cluster orbits (left panel) and stellar cluster aggregates (right panel). Darker lines trace the orbits forward in time, whereas lighter lines trace backward. Thin lines show orbit integrations from multiple initial condition extractions, while thicker lines show median orbits. Present-day cluster positions are also marked: orange diamonds for W345, purple circles for LISCA I, and green squares for LISCA II clusters.
Current usage metrics show cumulative count of Article Views (full-text article views including HTML views, PDF and ePub downloads, according to the available data) and Abstracts Views on Vision4Press platform.
Data correspond to usage on the plateform after 2015. The current usage metrics is available 48-96 hours after online publication and is updated daily on week days.
Initial download of the metrics may take a while.