Fig. 10
Download original image
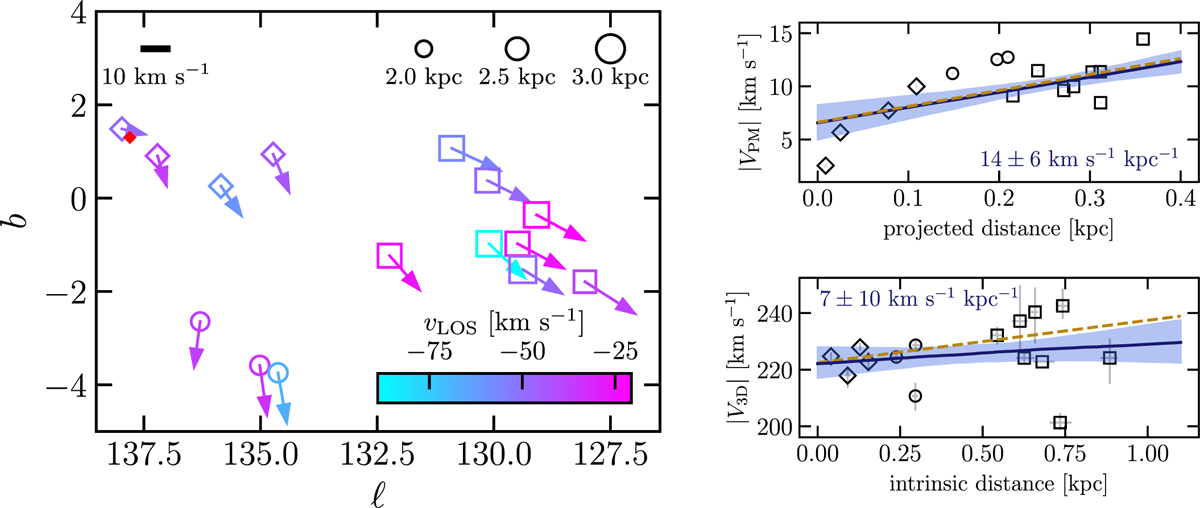
Projected kinematic properties for the Perseus star clusters. Left panel: spatial distribution of the Perseus complex star clusters. The arrows show the PM vectors, converted in km s−1 according to the cluster distance (that is in turn shown using different marker sizes; see the coding in the top right corner of the plot). The color-coding shows vLOS . All data are reported in Table 4. The red diamond shows the claimed expansion origin according to the study of Román-Zúñiga et al. (2019). Right panels: distance-absolute velocity plots for the projected quantities (top) and 3D quantities (i.e., accounting for the position in the Galaxy and vLOS velocity, bottom), and assuming that the Sun lies at a distance of 8.178 kpc (GRAVITY Collaboration 2019) from the Galactic center, 20.8 pc above the disk (Bennett & Bovy 2021) and that it is orbiting in the Galaxy at (VX, VY, VZ) = (11.1, 248.5, 7.25) km s−1 (Schönrich et al. 2010; Reid & Brunthaler 2020). In the top panel, on-sky distances are from the expansion center suggested by Román-Zúñiga et al. (2019). The velocities and distances were converted to physical units assuming the distance ofIC 1805 (see Table 4). In the bottom panel, the 3D distances are relative to IC 1805. Errors are computed by the propagation of distance and vLOS errors (reported in Table 4). Both sub-panels show the linear regression obtained from the cluster data (in blue) and by Román-Zúñiga et al. (2019, in brown). The best-fit angular coefficient obtained in this work is also reported. Finally, the shaded areas represent the 68% credible interval, corresponding to 1σ if the distribution were Gaussian.
Current usage metrics show cumulative count of Article Views (full-text article views including HTML views, PDF and ePub downloads, according to the available data) and Abstracts Views on Vision4Press platform.
Data correspond to usage on the plateform after 2015. The current usage metrics is available 48-96 hours after online publication and is updated daily on week days.
Initial download of the metrics may take a while.