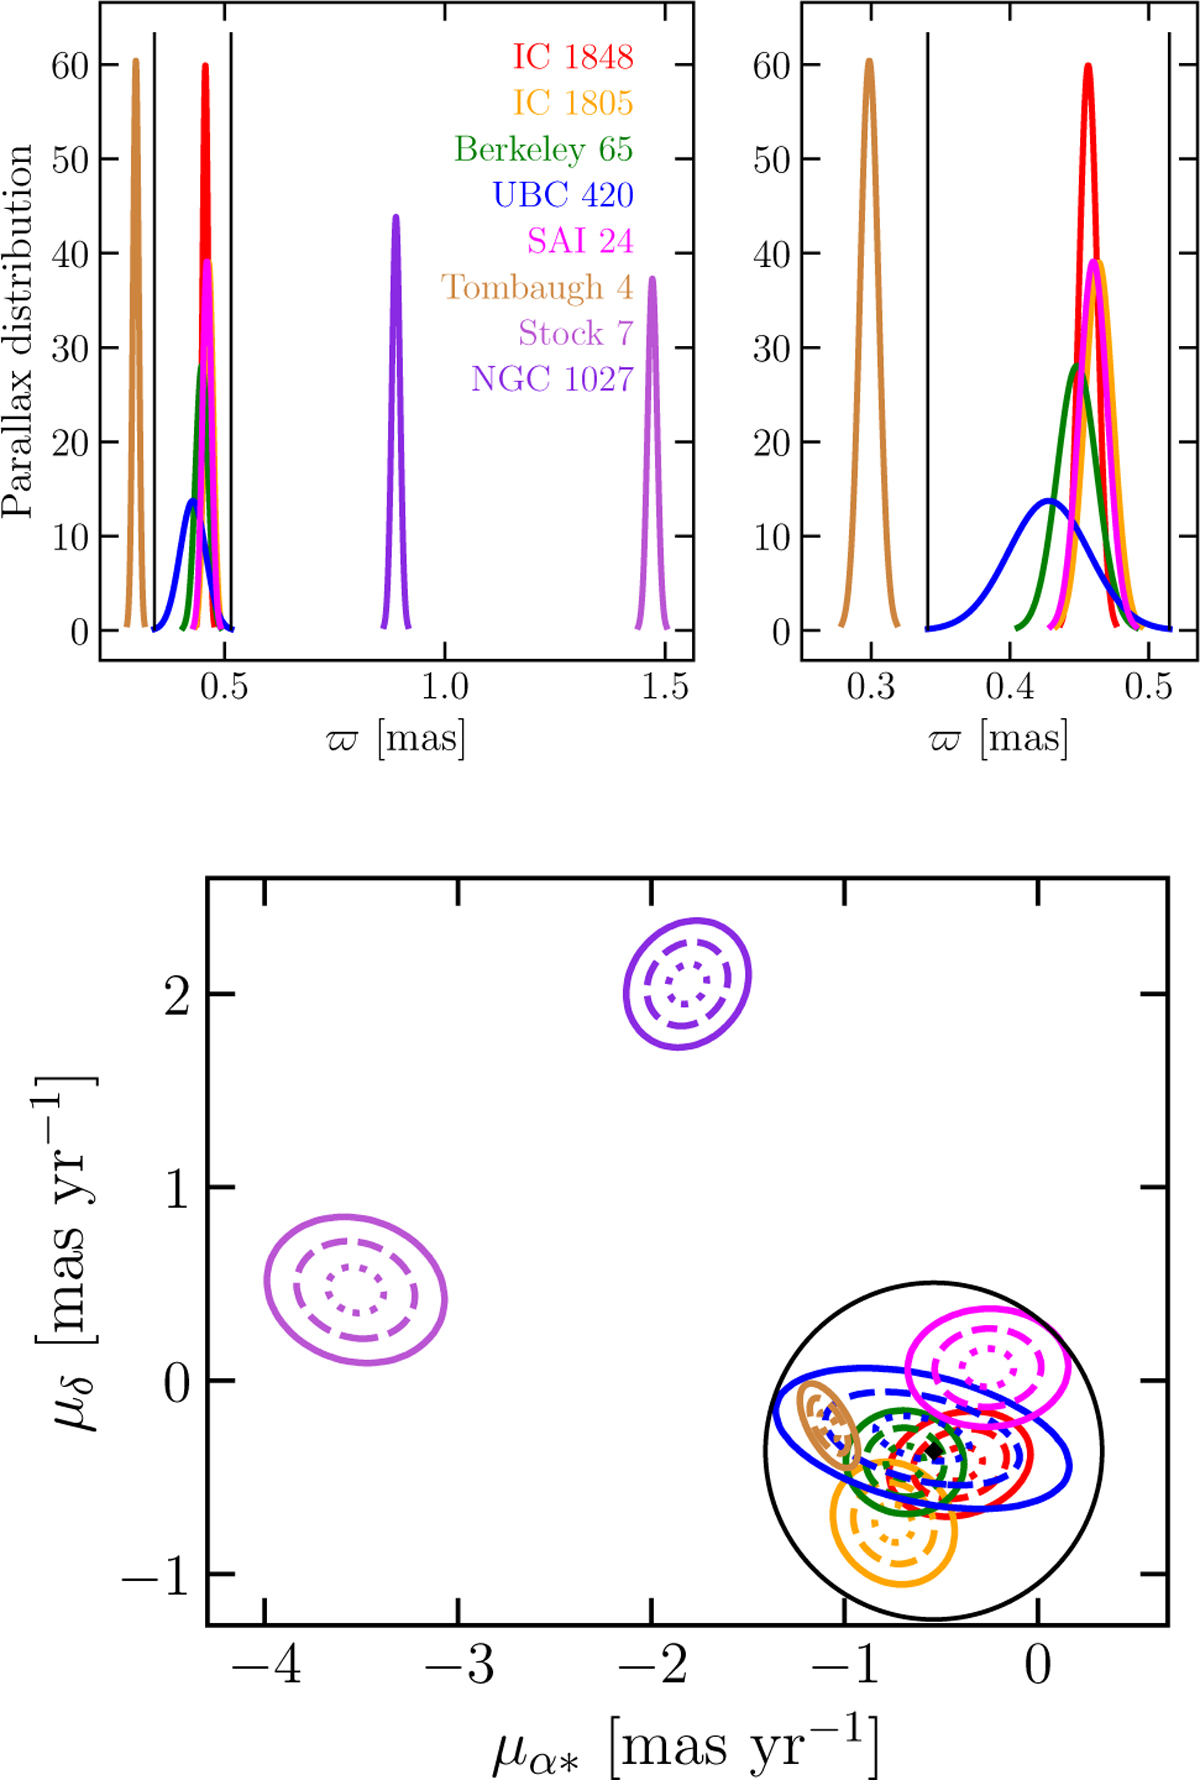
Fig. 1
Download original image
Intrinsic (i.e., deconvolved) parallax (top panel), and PM (bottom panel) distributions for the eight clusters in the region defined by the preliminary Galactic coordinates ranges. The cluster names are reported in the top left panel. The black lines show the parallax and PM ranges adopted for selecting Gaia sources. The top right panel shows a narrower parallax range centered around the W345 star clusters to visualize the cluster parallax distributions better. Finally, in the bottom panel, the different contours represent the 1σ (dotted lines), 2σ (dashed lines), and 3σ (solid lines) regions for each cluster. The correlations among μα, and μδ are also visible.
Current usage metrics show cumulative count of Article Views (full-text article views including HTML views, PDF and ePub downloads, according to the available data) and Abstracts Views on Vision4Press platform.
Data correspond to usage on the plateform after 2015. The current usage metrics is available 48-96 hours after online publication and is updated daily on week days.
Initial download of the metrics may take a while.