Fig. 7
Download original image
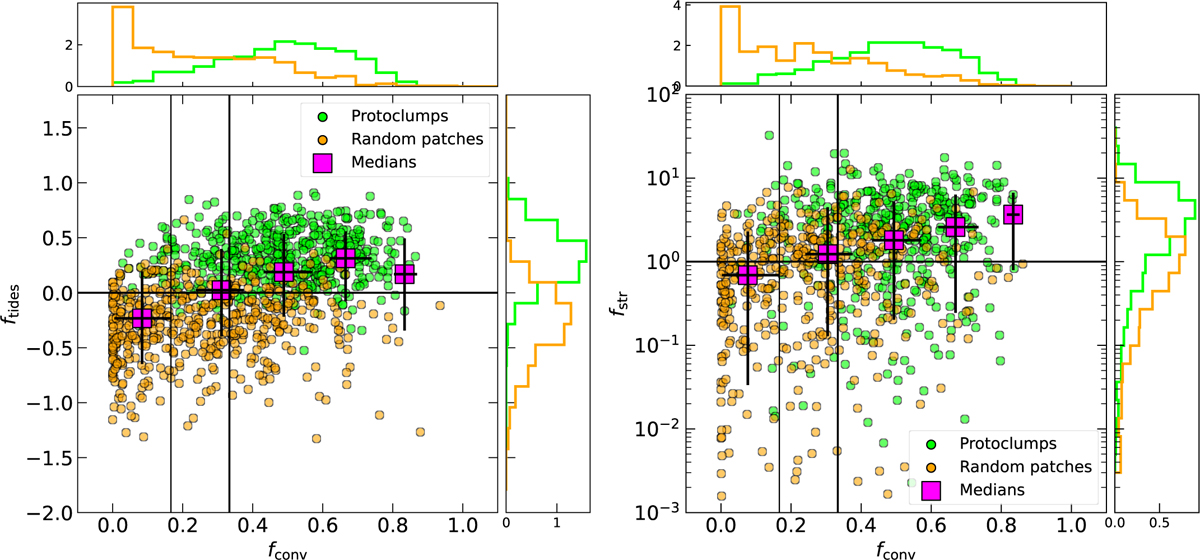
Correlations between fconv (x-axis) and ftides (left) or fstr (right). Each point is either a protoclump (green points) or a random patch (orange points). The histograms are the projected distributions of the corresponding quantity. The vertical black lines correspond to fconv = 16% and fconv = 33%. The magenta squares are the medians of all of the points in bins of fconv, and the error bars are the 16th and 84th percentiles of each quantity. Both ftides and fstr show a positive correlation with fconv. The Spearman correlation coefficient for ftides and fstr against fconv are 0.46 and 0.3, with p-values of 2 · 10−3, 5 · 10−3, respectively. Furthermore, protoclump regions occupy the upper-right quadrants in both panels.
Current usage metrics show cumulative count of Article Views (full-text article views including HTML views, PDF and ePub downloads, according to the available data) and Abstracts Views on Vision4Press platform.
Data correspond to usage on the plateform after 2015. The current usage metrics is available 48-96 hours after online publication and is updated daily on week days.
Initial download of the metrics may take a while.