Fig. 6
Download original image
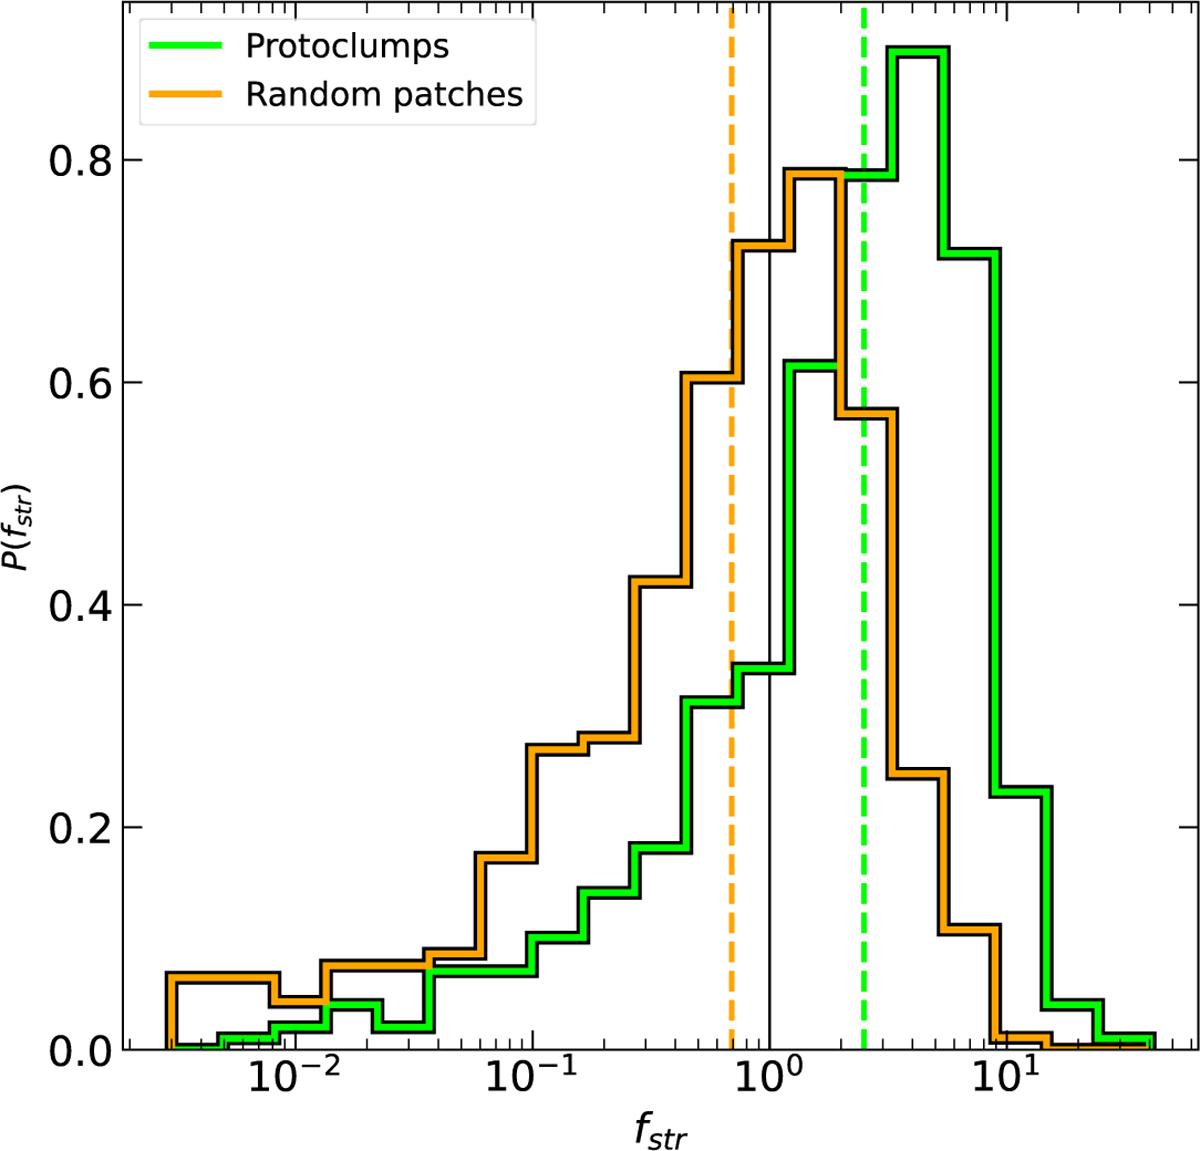
Same as Figure 4 but for fstr, which measures the amount of stream mass in a given region (see text). The vertical black line is at fstr = 1. One can see that protoclump regions tend to have larger fstr than random patches, indicating that they reside in regions with intense accretion. The median fstr for protoclumps is 2.5, while for random patches it is 0.8.
Current usage metrics show cumulative count of Article Views (full-text article views including HTML views, PDF and ePub downloads, according to the available data) and Abstracts Views on Vision4Press platform.
Data correspond to usage on the plateform after 2015. The current usage metrics is available 48-96 hours after online publication and is updated daily on week days.
Initial download of the metrics may take a while.