Fig. 5
Download original image
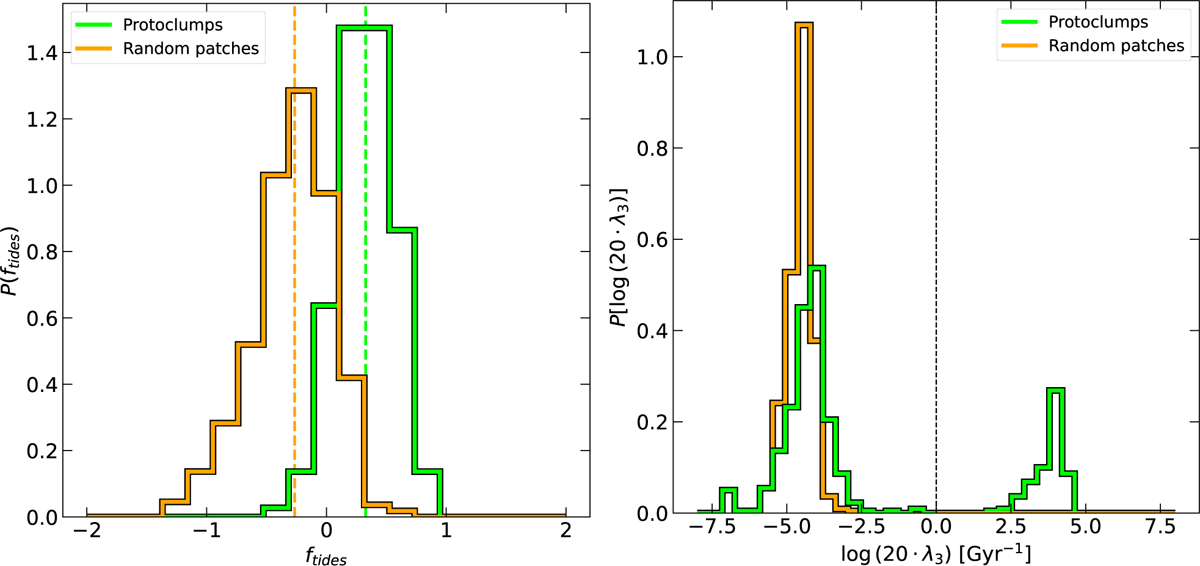
Probability distributions of ftides (left) and λ3 (right) in protoclump regions (green histograms) and random patches (orange histograms). In the left panel, vertical lines of different colors indicate the median of the corresponding distribution, 0.33 and −0.27 for protoclumps and random patches, respectively. The ftides in protoclump regions are mostly positive, indicating substantial or fully compressive tides, while random patches mostly have ftides < 0, indicating substantial stripping. In the right panel, λ3 was scaled by 20 in order to separate negative and positive values and present them in a logarithmic scale. Negative values are actually − log(−20 · λ3) (e.g., a value of −5 along the x-axis represents −105 Gyr−1). We note that λ3 is positive almost exclusively in protoclump regions, and about ~25% of the protoclump regions have λ3 > 0, implying fully compressive tides.
Current usage metrics show cumulative count of Article Views (full-text article views including HTML views, PDF and ePub downloads, according to the available data) and Abstracts Views on Vision4Press platform.
Data correspond to usage on the plateform after 2015. The current usage metrics is available 48-96 hours after online publication and is updated daily on week days.
Initial download of the metrics may take a while.