Fig. 4
Download original image
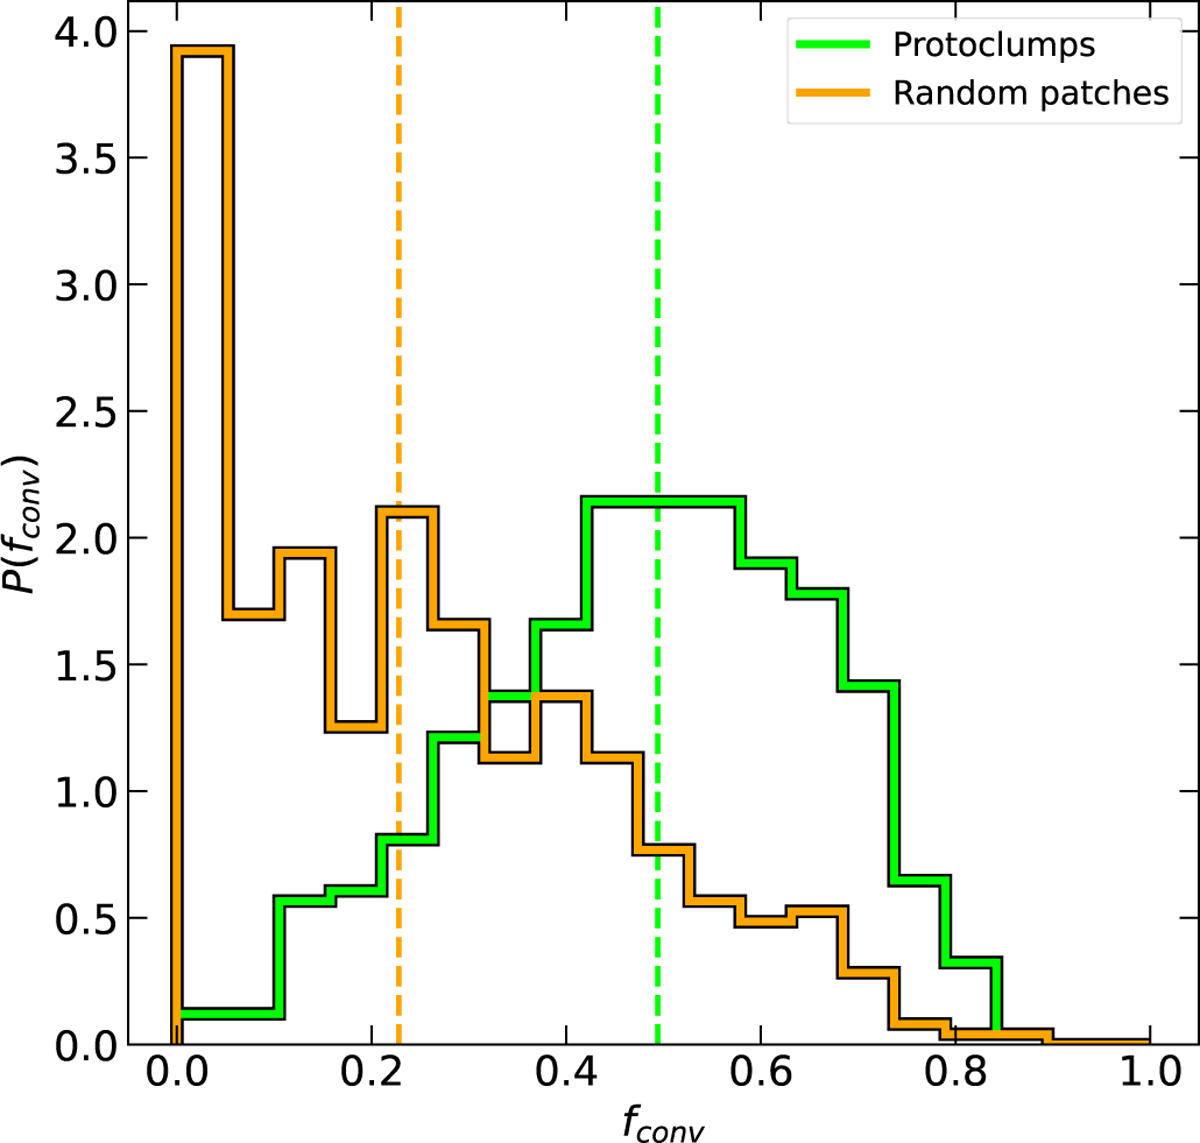
Probability distribution of fconv in protoclump regions (green histogram) and random patches (orange histogram) over all eight galaxies. The vertical lines of each color indicate the median of the corresponding distribution. One can see that protoclump regions have a median fconv ~ 0.5, while random patches have a median fconv ~ 0.21, meaning that protoclump regions have a strong excess in converging modes compared to random patches in the disk, which are more in agreement with equilibrium values.
Current usage metrics show cumulative count of Article Views (full-text article views including HTML views, PDF and ePub downloads, according to the available data) and Abstracts Views on Vision4Press platform.
Data correspond to usage on the plateform after 2015. The current usage metrics is available 48-96 hours after online publication and is updated daily on week days.
Initial download of the metrics may take a while.