Fig. 3
Download original image
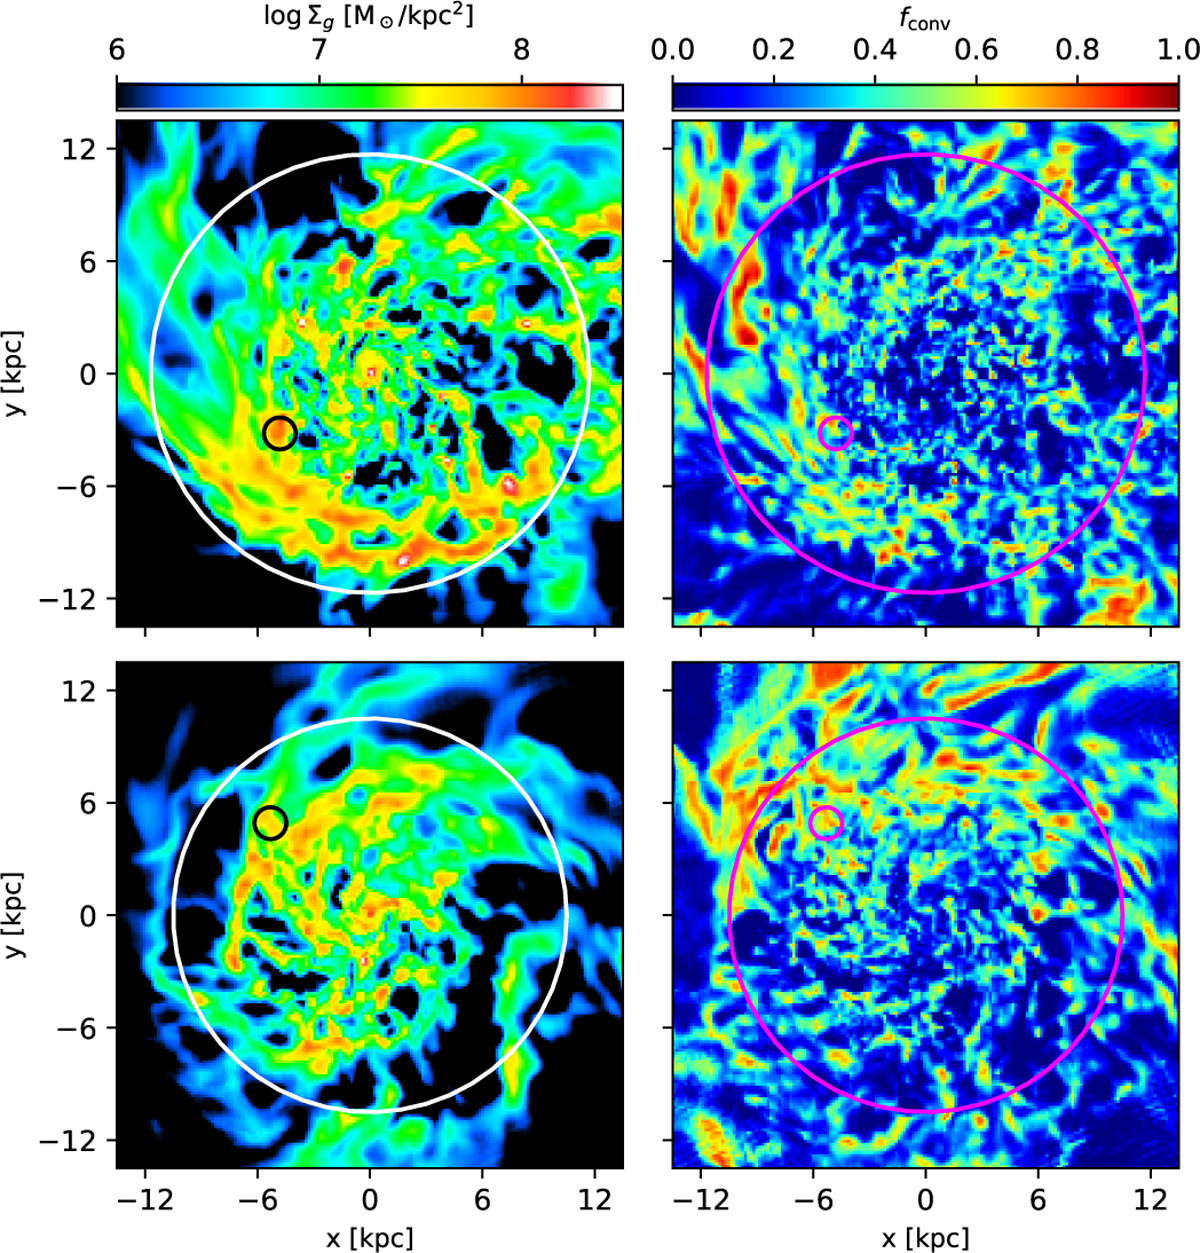
Correlation of fconv with gas density in protoclump regions. In the left panels, we show the projected surface density of the gas. The top row represents V07 at z ~ 2, while the bottom row represents V08 at z ~ 1, as in Figure 1. The black circles indicate the location of a protoclump region. The white circle is the disk radius, defined as the radius that contains 85% of the cold gas in the disk. In the right panels, we show maps of mass weighted projections of fconv in the same snapshot. The small magenta circle shows the location of the same protoclump region, while the large magenta circle is the disk radius. One can see that inside the region of the protoclump, most of the mass has fconv ~0.5–0.8. Furthermore, we observed that the protoclump regions are close to where the stream joins the disk (see Sect. 2.5 and Figure 1).
Current usage metrics show cumulative count of Article Views (full-text article views including HTML views, PDF and ePub downloads, according to the available data) and Abstracts Views on Vision4Press platform.
Data correspond to usage on the plateform after 2015. The current usage metrics is available 48-96 hours after online publication and is updated daily on week days.
Initial download of the metrics may take a while.