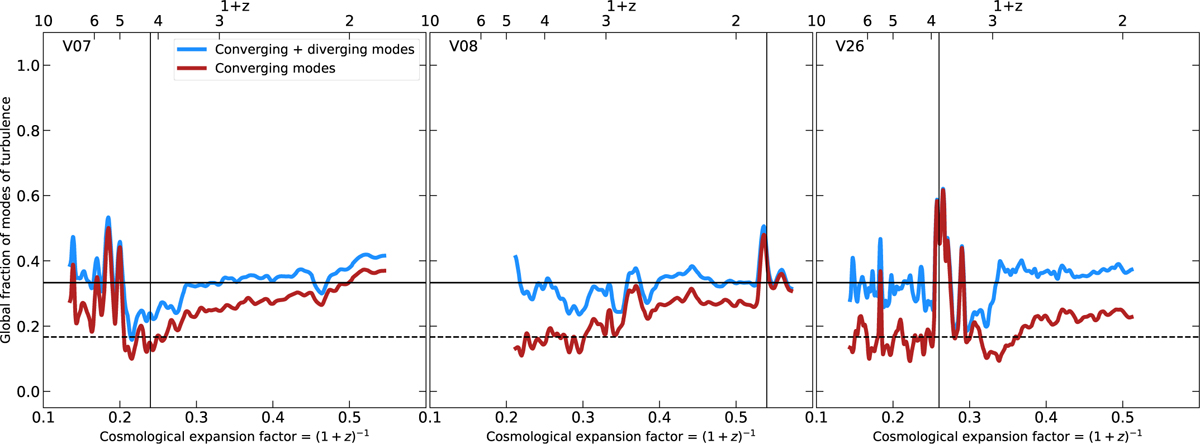
Fig. 2
Download original image
Temporal evolution of the global fraction of turbulent energy in converging and diverging flows (blue curve) and in only converging (i.e., only cells with ∇ · v < 0; red curve) flows for three galaxies from our suite. The vertical black line indicates the moment of the blue nugget phase in each galaxy (Lapiner et al. 2023). The horizontal solid (dashed) lines indicate one third (sixth) of the total energy, values expected for fully isotropic and homogeneous turbulence in equipartition. Each of the blue nugget phases are preceded by at least one major merger, which increases the global fraction in compressive turbulence, before settling back to the equilibrium values.
Current usage metrics show cumulative count of Article Views (full-text article views including HTML views, PDF and ePub downloads, according to the available data) and Abstracts Views on Vision4Press platform.
Data correspond to usage on the plateform after 2015. The current usage metrics is available 48-96 hours after online publication and is updated daily on week days.
Initial download of the metrics may take a while.