Open Access
Fig. 2
Download original image
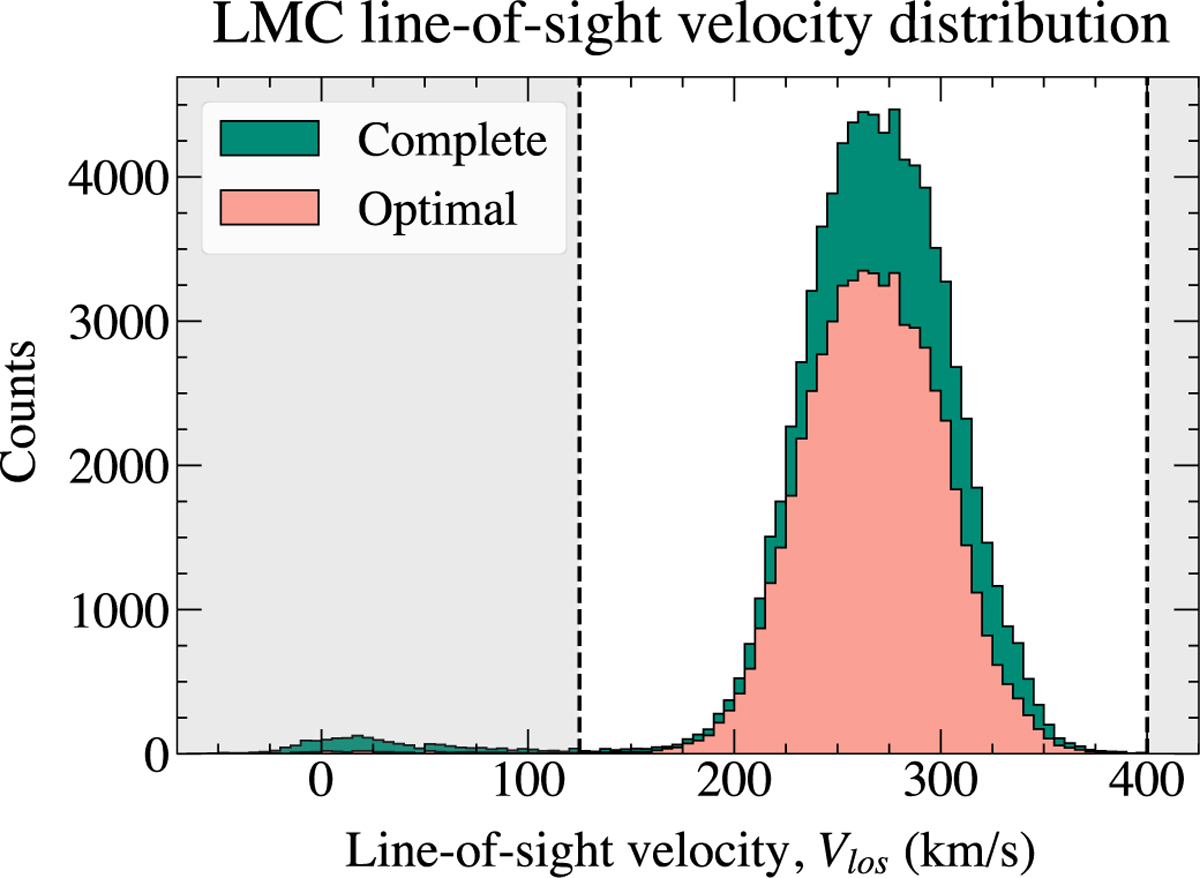
Distribution of the line-of-sight velocities of the LMC Combined complete (green) and optimal (salmon) sample. The vertical black dashed lines delimit the area of the LMC stars that are kept, namely, 125 km/s < Vlos < 400 km/s, to reduce MW foreground contamination.
Current usage metrics show cumulative count of Article Views (full-text article views including HTML views, PDF and ePub downloads, according to the available data) and Abstracts Views on Vision4Press platform.
Data correspond to usage on the plateform after 2015. The current usage metrics is available 48-96 hours after online publication and is updated daily on week days.
Initial download of the metrics may take a while.