Fig. 11
Download original image
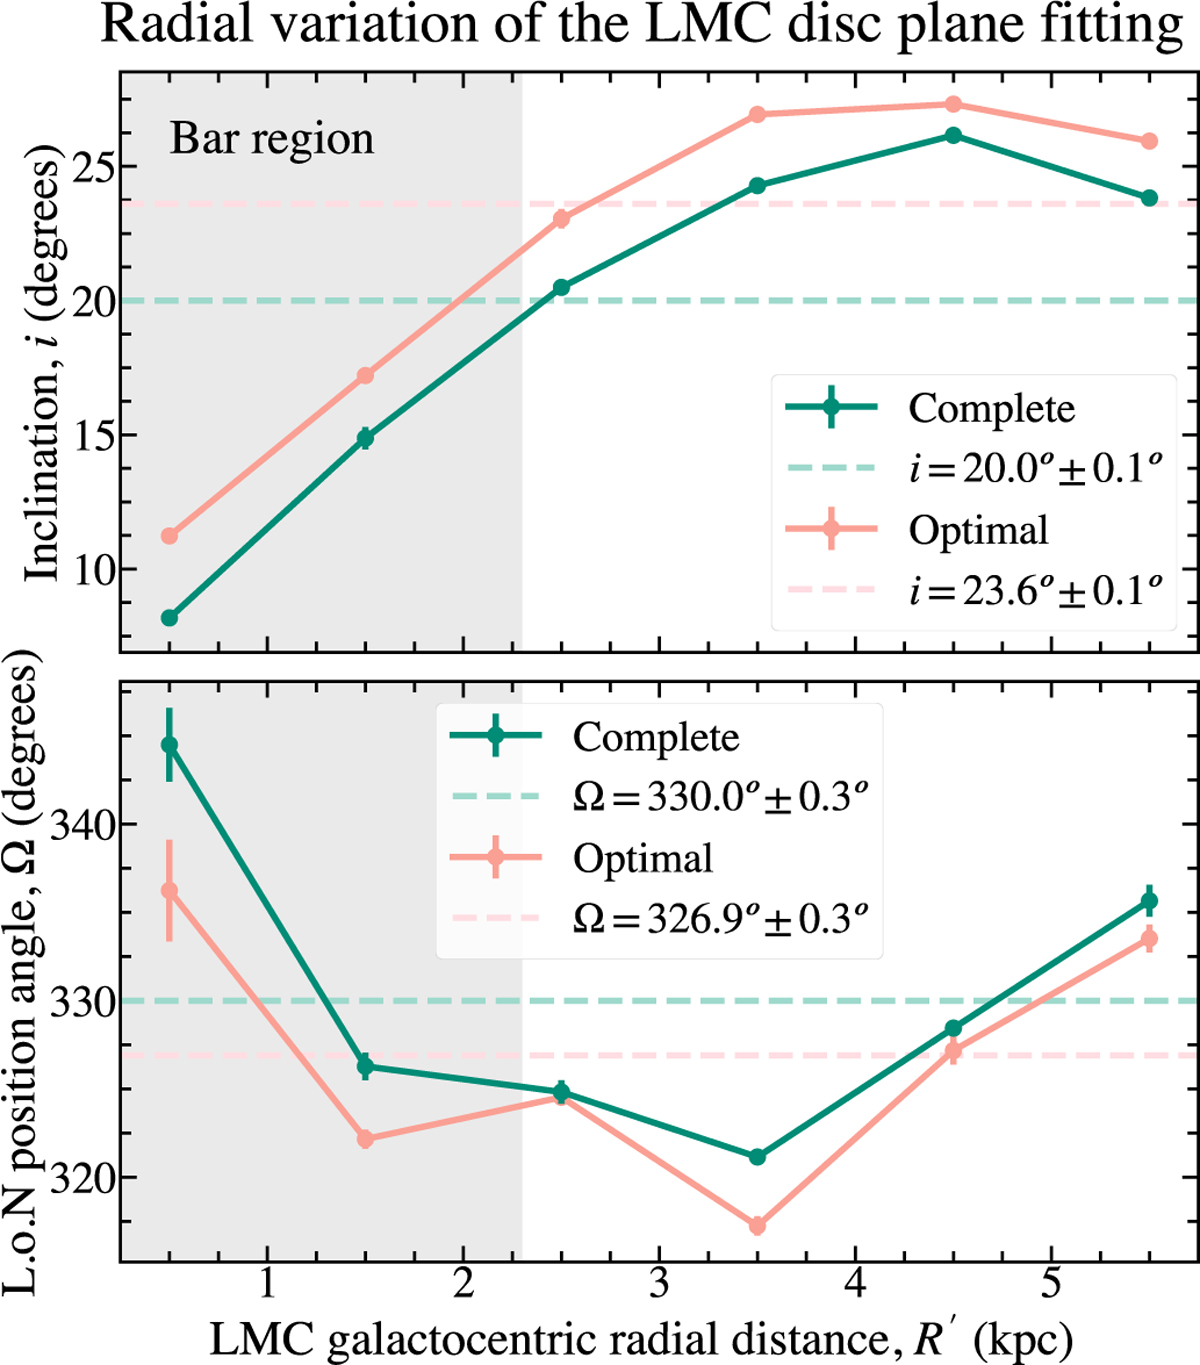
Variation in the LMC disc plane fitting as a function of the LMC galactocentric radius R′. Top: inclination i. Bottom: line-of-nodes position angle Ω. The ‘global’ fit derived in Sect. 4.2 is displayed by the horizontal dashed lines. We use a grey shaded area to draw attention to the bar region (R′bar = 2.3 kpc, Jiménez-Arranz et al. 2023b). In all panels we display the LMC complete (optimal) sample in green (salmon).
Current usage metrics show cumulative count of Article Views (full-text article views including HTML views, PDF and ePub downloads, according to the available data) and Abstracts Views on Vision4Press platform.
Data correspond to usage on the plateform after 2015. The current usage metrics is available 48-96 hours after online publication and is updated daily on week days.
Initial download of the metrics may take a while.