Open Access
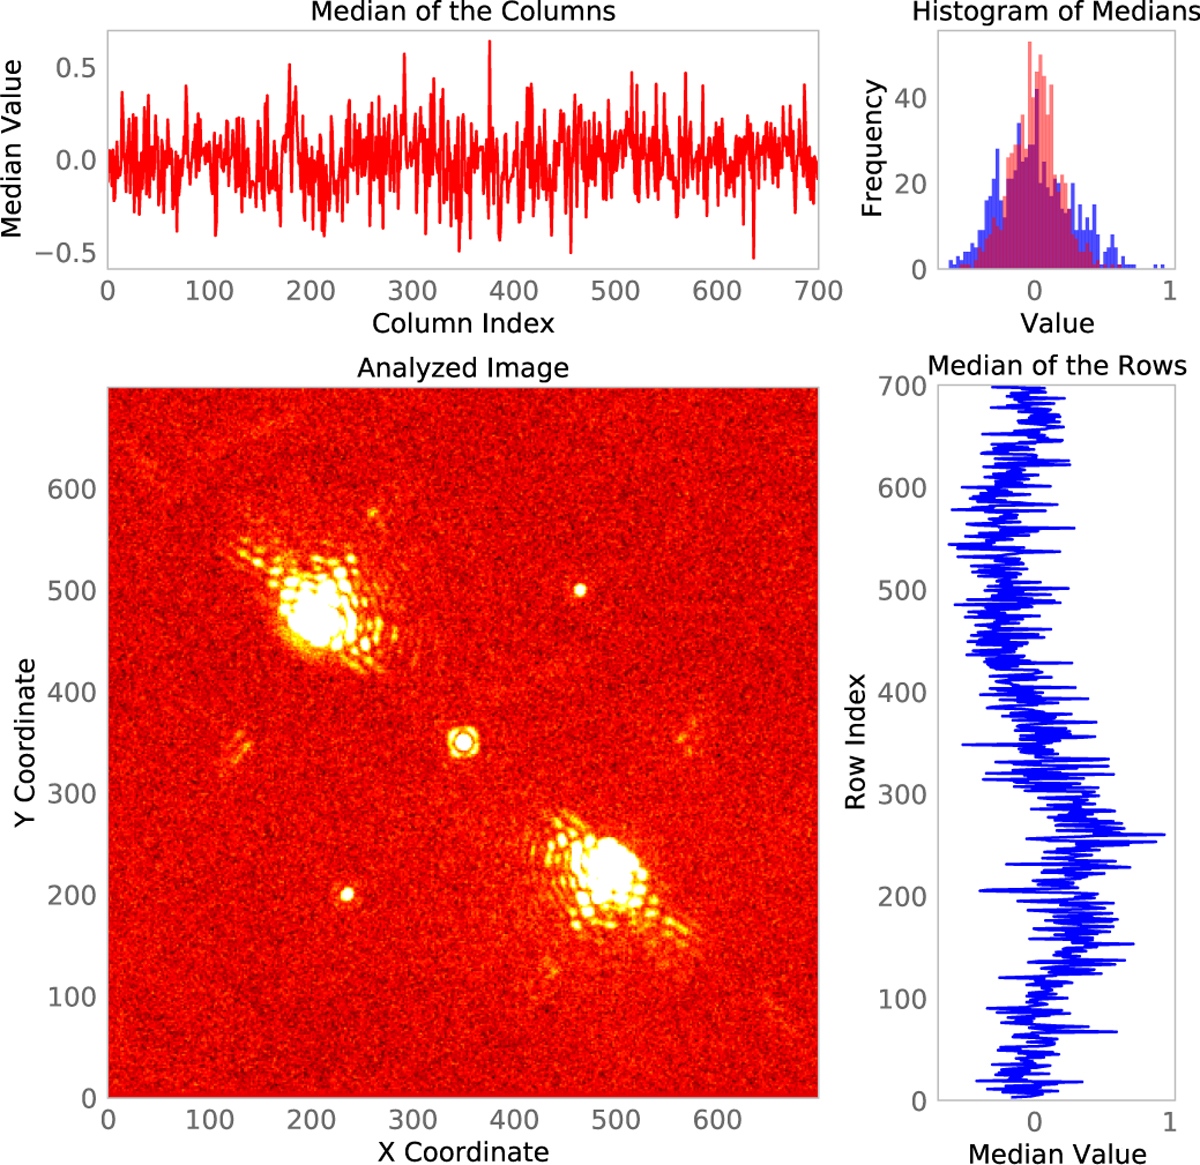
Fig. E.22
Download original image
Example of the analysis of the vertical and horizontal stripes of the background. On the right you can find the trend of the counts of the lines and at the top of the columns. This example shows PDS 70 where the cleaning has left no obvious residues.
Current usage metrics show cumulative count of Article Views (full-text article views including HTML views, PDF and ePub downloads, according to the available data) and Abstracts Views on Vision4Press platform.
Data correspond to usage on the plateform after 2015. The current usage metrics is available 48-96 hours after online publication and is updated daily on week days.
Initial download of the metrics may take a while.