Fig. 4
Download original image
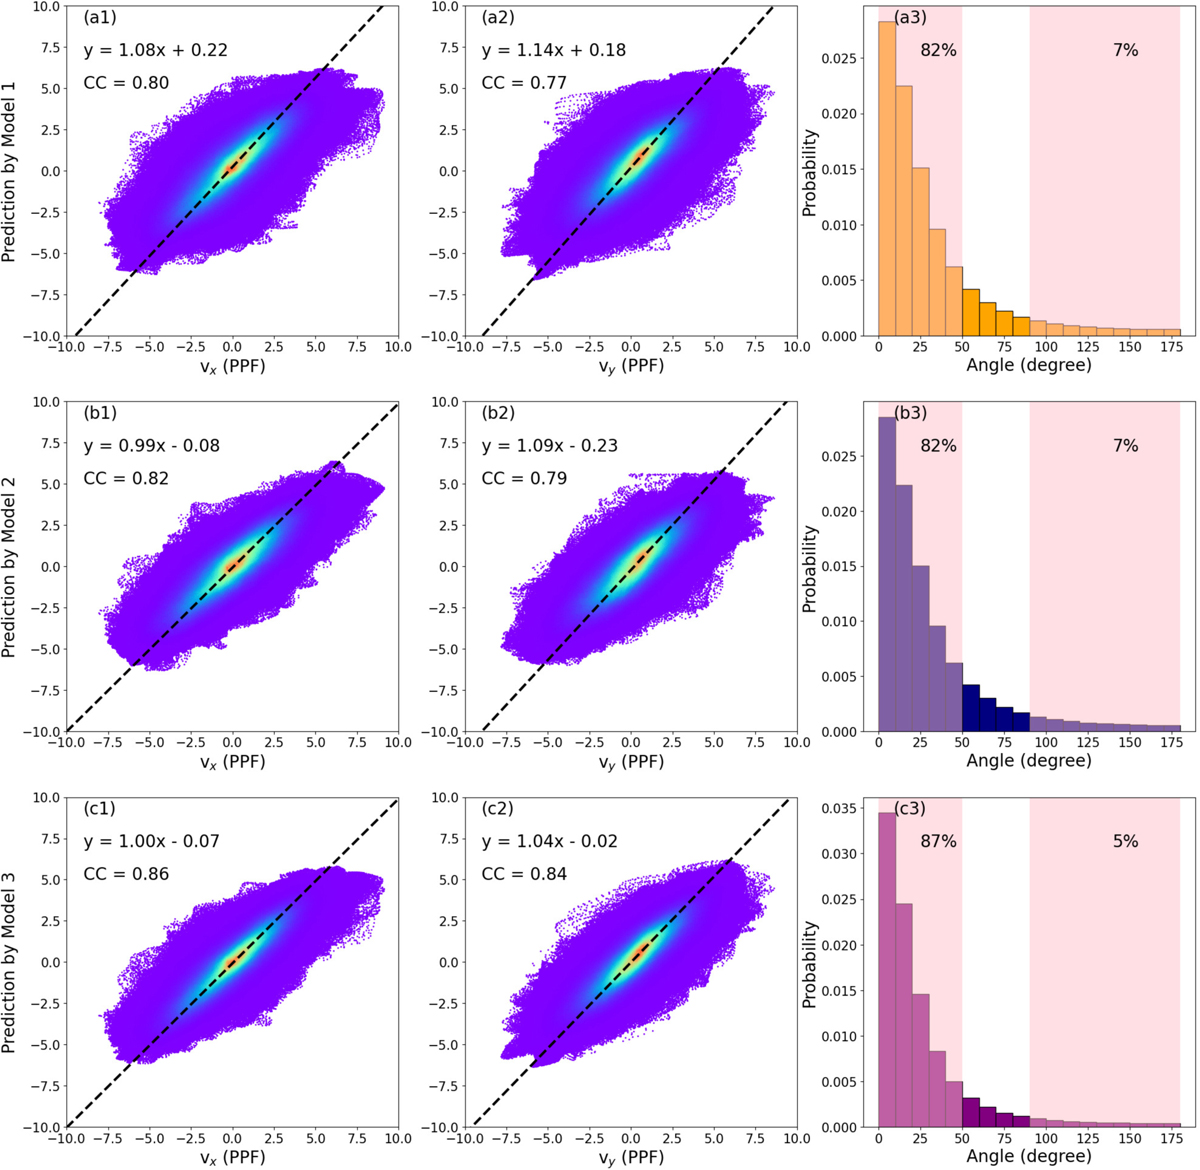
Correlation between the Shallow U-Net velocity fields and the ground truth. Panels (a1), (b1) and (c1) are the pixel-to-pixel correlations between the ground-truth vx and the model estimated vx by the three shallow U-Net models. Colors in these panels depict the number densities of points at each coordinate, with warmer colors for higher number densities. Black dashed lines are the corresponding linear fit results, with their functions displayed on the top left corner of each panel. Panels (a2), (b2), and (c2) are similar to panels (a1), (b1), and (c1) but for vy. Panels (a3), (b3), and (c3) are the distribution of the angles between the ground-truth velocity fields and the estimated velocity fields by the three shallow U-Net models.
Current usage metrics show cumulative count of Article Views (full-text article views including HTML views, PDF and ePub downloads, according to the available data) and Abstracts Views on Vision4Press platform.
Data correspond to usage on the plateform after 2015. The current usage metrics is available 48-96 hours after online publication and is updated daily on week days.
Initial download of the metrics may take a while.