Fig. 3
Download original image
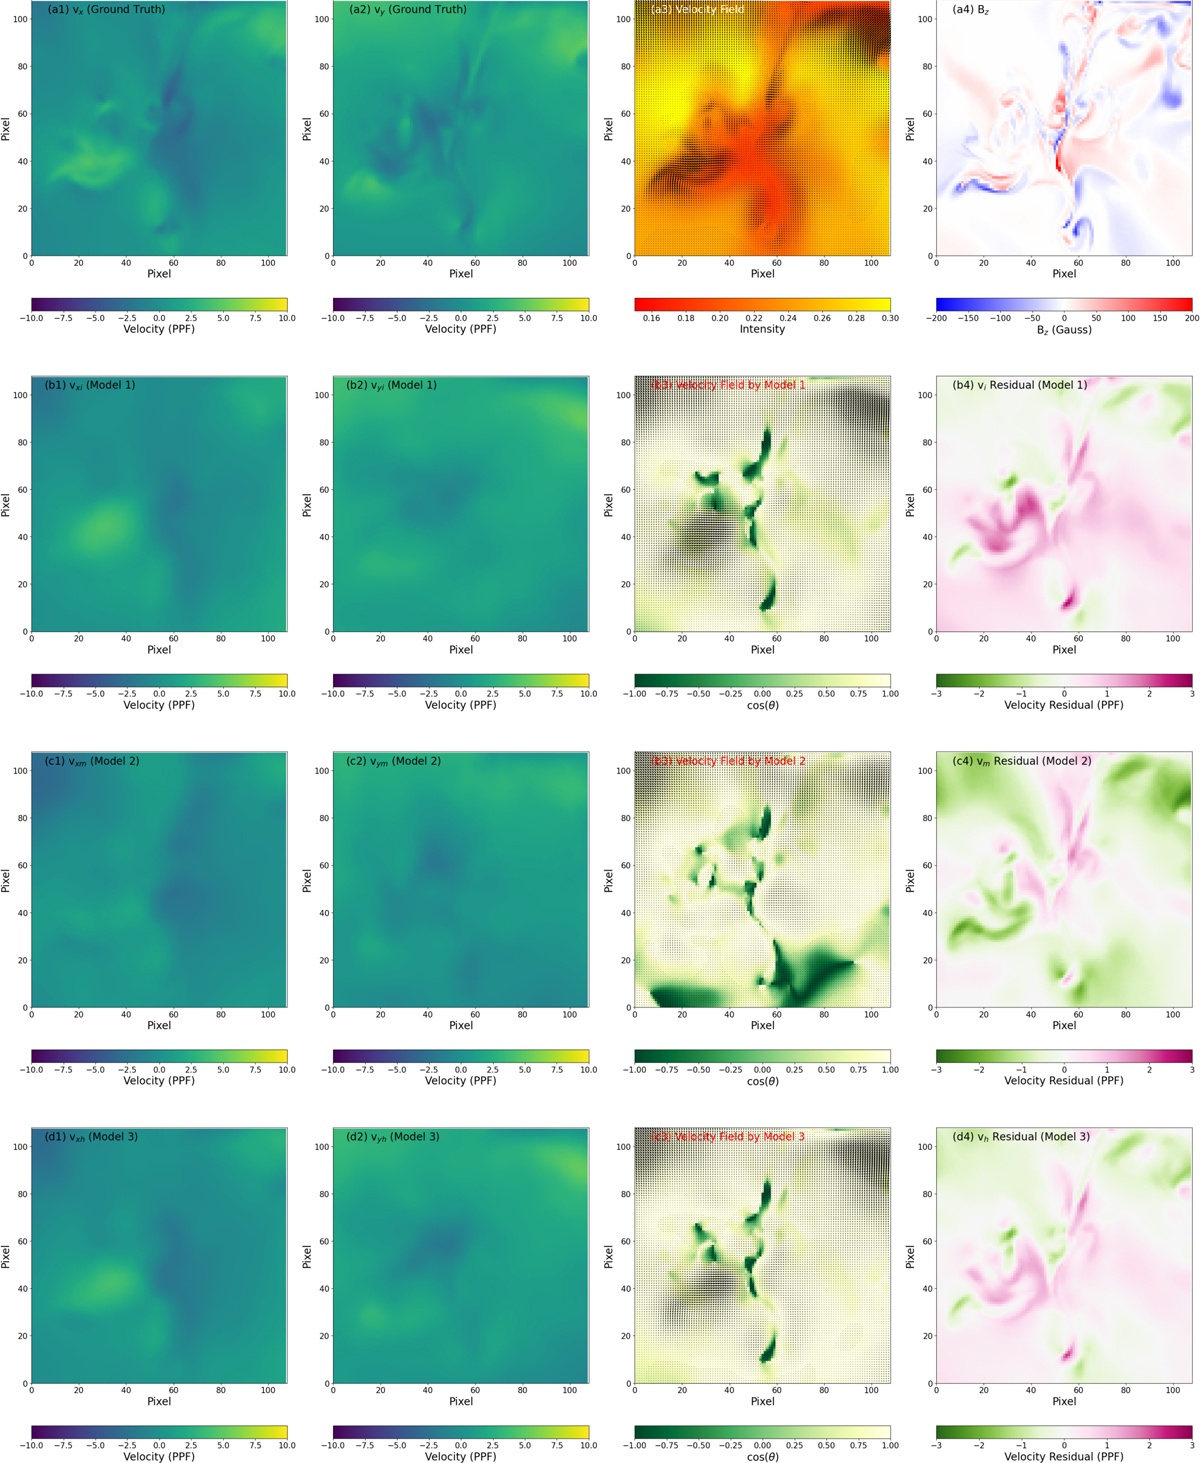
Example velocity fields by the shallow U-Net models. Panels in the first column are the ground-truth vx (a1) and estimated vx by the intensity model (b1), magnetic model (c1) and hybrid model (d1), respectively. Panels in the second column are similar to panels in the first column, but for the velocity field along the y direction (vy). The background in panel (a3) shows the photospheric intensity with the black arrows depicting the vector velocity field. Panel (a4) represents the photospheric vertical magnetic field strength. Backgrounds in panels (b3)–(d3) are the cosine of the angle (θ) between the estimated and ground-truth velocity field by the three shallow U-Net models, with the black arrows depicting the estimated vector velocity fields by the models. Panels (b4)–(d4) are the distributions of the velocity differences between the ground-truth and estimated velocity fields by the three shallow U-Net models.
Current usage metrics show cumulative count of Article Views (full-text article views including HTML views, PDF and ePub downloads, according to the available data) and Abstracts Views on Vision4Press platform.
Data correspond to usage on the plateform after 2015. The current usage metrics is available 48-96 hours after online publication and is updated daily on week days.
Initial download of the metrics may take a while.