Fig. 1
Download original image
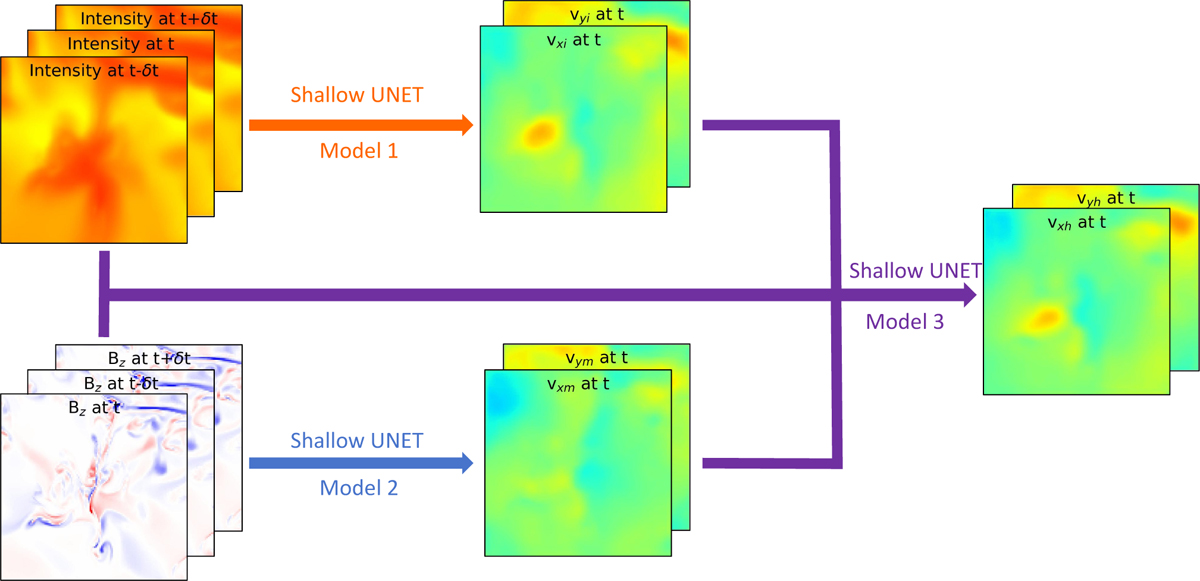
Flow chart of the three shallow U-Net models. Photospheric intensity and vertical magnetic field (Bz) data are from the numerical simulation detailed in the main text. Three models are illustrated in this flow chart. Model 1 (intensity model) takes three consecutive frames of the photospheric intensity as input. Model 2 (magnetic model) takes three successive frames of the photospheric vertical magnetic field strength as input. Model 3 (hybrid model) combines the inputs and outputs of Model 1 and Model 2 as its input. The outputs of the three models are images with two channels; the first channel is the velocity field along the x direction (vx) and the second channel is the velocity field along the y direction (vy). Here, δt represents the cadence of the data (10 s). Subscripts i, m, and h denote outputs of the intensity, magnetic, and hybrid models, respectively.
Current usage metrics show cumulative count of Article Views (full-text article views including HTML views, PDF and ePub downloads, according to the available data) and Abstracts Views on Vision4Press platform.
Data correspond to usage on the plateform after 2015. The current usage metrics is available 48-96 hours after online publication and is updated daily on week days.
Initial download of the metrics may take a while.