Open Access
Fig. A.2.
Download original image
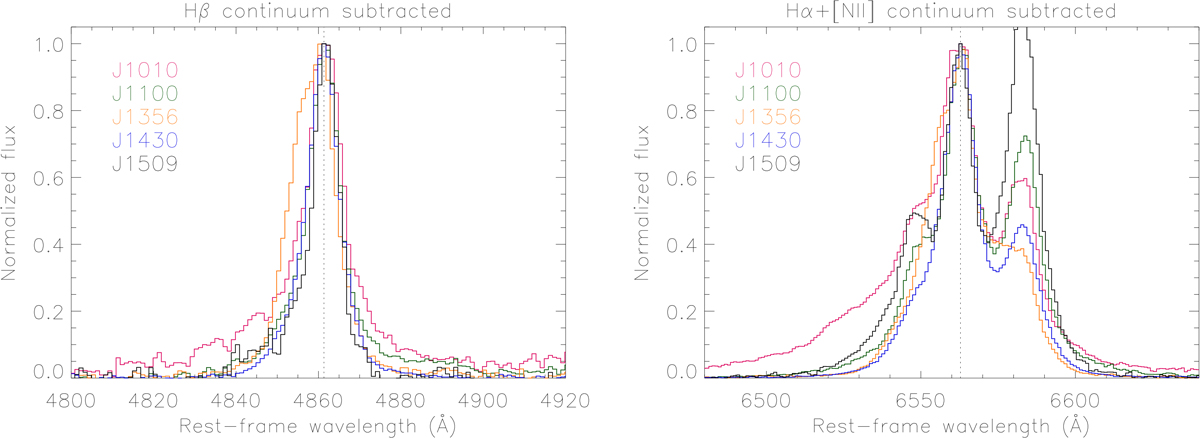
Continuum-subtracted spectrum of J1010 around the Hβ (left panel) Hα+[NII] emission line complex (right panel), both normalized to the peak of the recombination line, respectively. The vertical dotted lines correspond to the rest-frame wavelength of Hβ and Hα.
Current usage metrics show cumulative count of Article Views (full-text article views including HTML views, PDF and ePub downloads, according to the available data) and Abstracts Views on Vision4Press platform.
Data correspond to usage on the plateform after 2015. The current usage metrics is available 48-96 hours after online publication and is updated daily on week days.
Initial download of the metrics may take a while.