Fig. 6.
Download original image
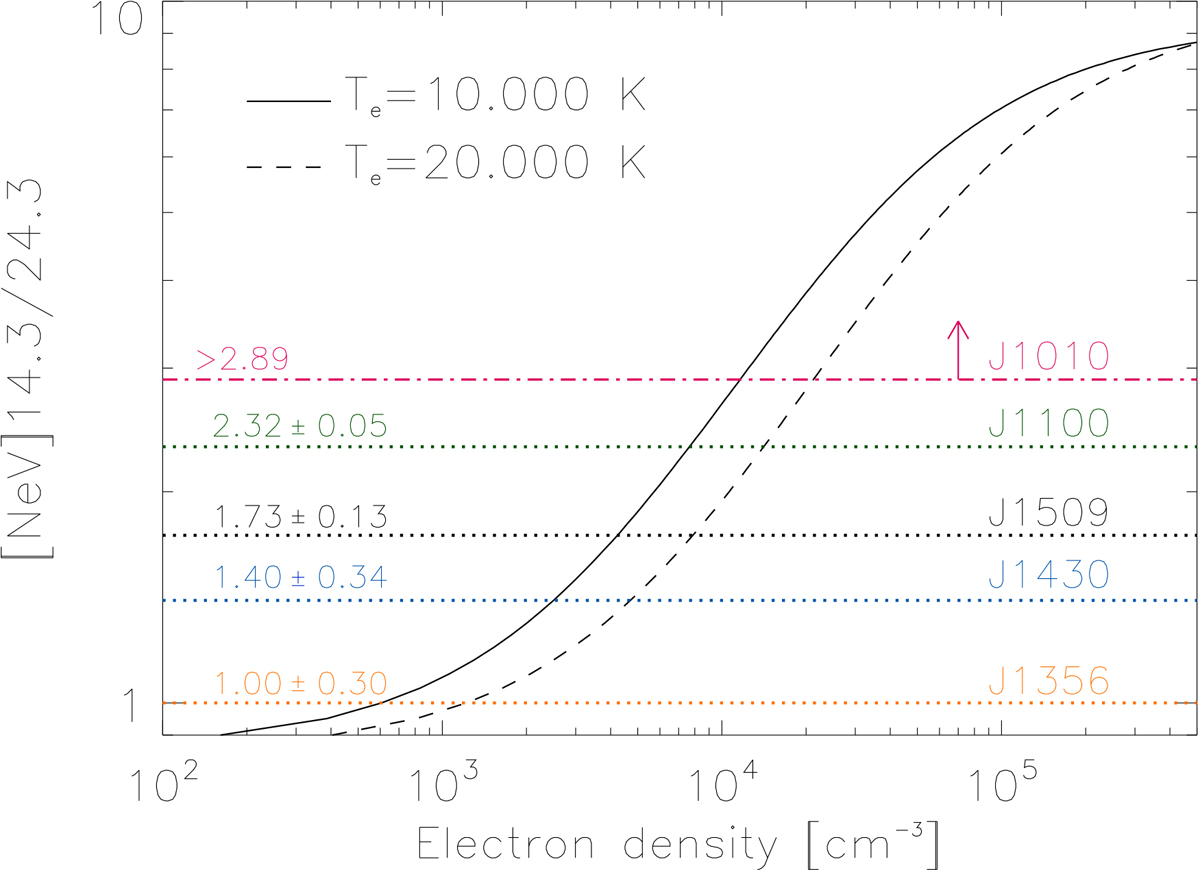
Density-sensitive ratio of [NeV]14.3/24.3 as a function of electron density modeled with PyNeb (version 1.1.19; Luridiana et al. 2015). Solid and dashed lines correspond to electron temperatures of 104 and 2×10⁴ K, respectively. The values of the flux ratio measured from the nuclear spectra are shown as dotted lines of different colors, and the upper limit measured for J1010 as dot-dashed line.
Current usage metrics show cumulative count of Article Views (full-text article views including HTML views, PDF and ePub downloads, according to the available data) and Abstracts Views on Vision4Press platform.
Data correspond to usage on the plateform after 2015. The current usage metrics is available 48-96 hours after online publication and is updated daily on week days.
Initial download of the metrics may take a while.