Fig. 1.
Download original image
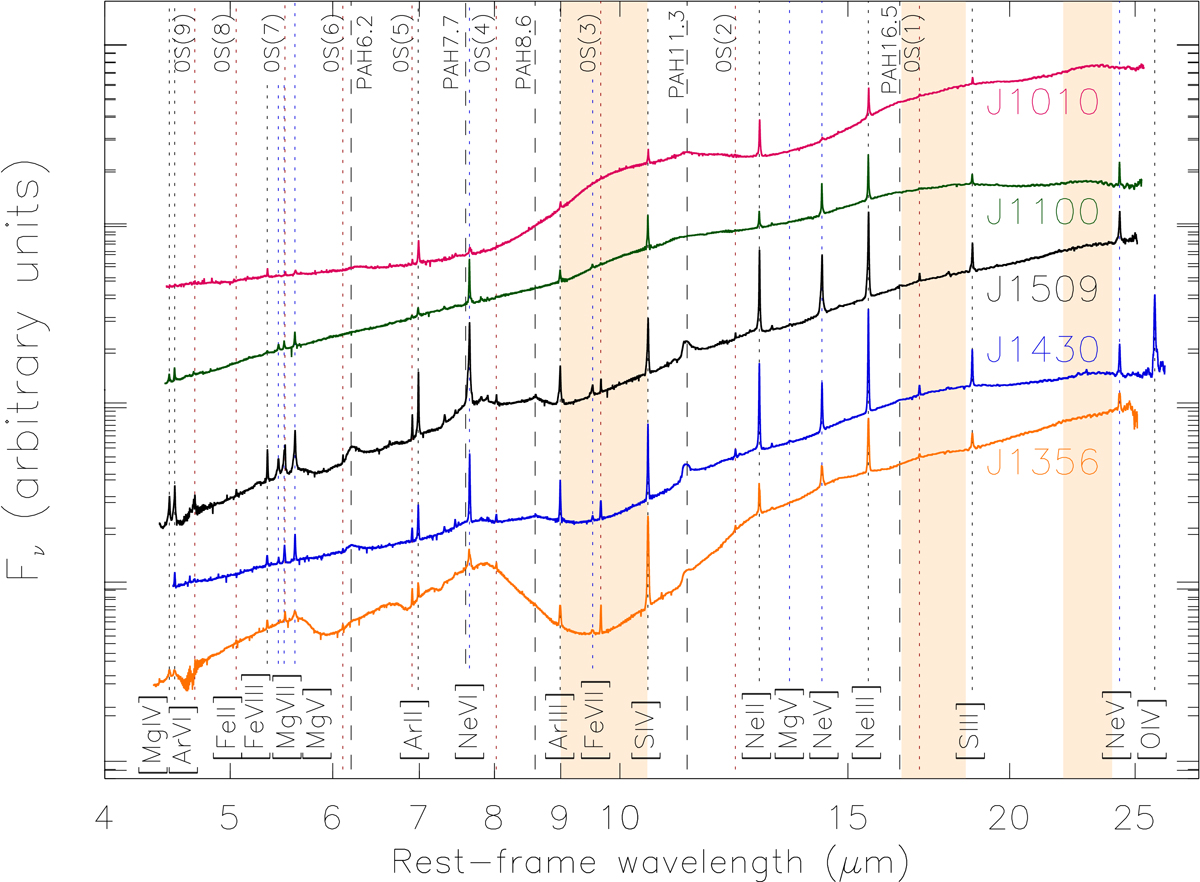
JWST/MIRI nuclear spectra of the central 0.7–1.3 kpc of the QSO2s, scaled in the Y-axis using a multiplicative factor to sort them out according to S9.7 and smoothed using a boxcar of five. For reference, the flux densities at 20 μm measured from these nuclear spectra are 464, 249, 144, 114, and 75 mJy for J1100, J1010, J1430, J1356, and J1509. The amorphous silicate features at 9.7 and 18 μm and the crystalline silicate feature at 23 μm are highlighted with the light orange areas. The most intense emission lines and PAHs are labeled, with the high- and low-ionization atomic lines shown with blue and black dotted lines, molecular lines with red dotted lines, and PAH bands with black dashed lines.
Current usage metrics show cumulative count of Article Views (full-text article views including HTML views, PDF and ePub downloads, according to the available data) and Abstracts Views on Vision4Press platform.
Data correspond to usage on the plateform after 2015. The current usage metrics is available 48-96 hours after online publication and is updated daily on week days.
Initial download of the metrics may take a while.