Fig. 6
Download original image
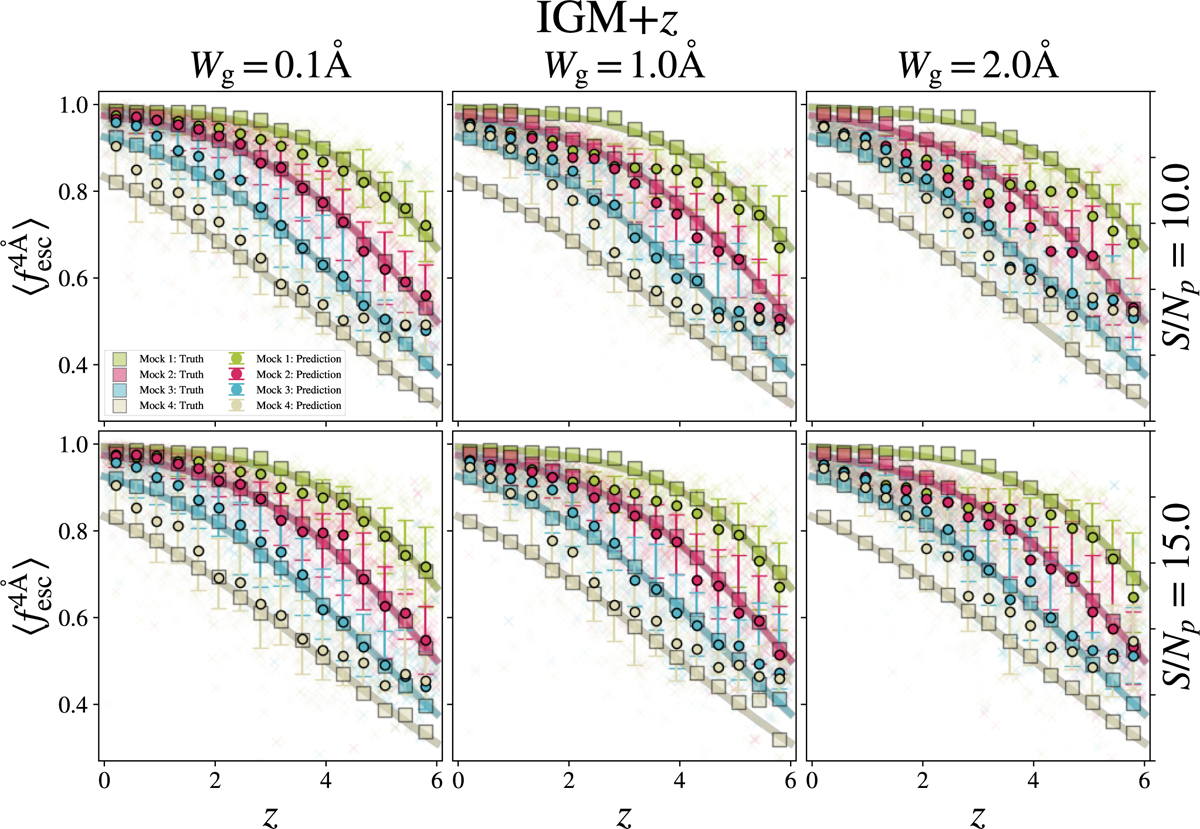
zELDA’s prediction of mean ![]() for different mock Lyα line profiles using the IGM+z model. Each panel shows a different observation quality. The top and bottom rows display S/Np=10.0 and S/Np = 15.0, respectively. Each column has a constant Wg. In particular, we show Wg = 0.1 Å, 1.0 Å, and 2.0 Å from left to right. Four mean
for different mock Lyα line profiles using the IGM+z model. Each panel shows a different observation quality. The top and bottom rows display S/Np=10.0 and S/Np = 15.0, respectively. Each column has a constant Wg. In particular, we show Wg = 0.1 Å, 1.0 Å, and 2.0 Å from left to right. Four mean ![]() z evolution scenarios are considered, which are shown as solid lines (green, red, blue, and grey). The true mean
z evolution scenarios are considered, which are shown as solid lines (green, red, blue, and grey). The true mean ![]() in the mocks is shown as coloured squares. zELDA’s predictions for individual Lyα line profiles are marked as crosses. The mean
in the mocks is shown as coloured squares. zELDA’s predictions for individual Lyα line profiles are marked as crosses. The mean ![]() from zELDA’s prediction is shown in circles with its uncertainty.
from zELDA’s prediction is shown in circles with its uncertainty.
Current usage metrics show cumulative count of Article Views (full-text article views including HTML views, PDF and ePub downloads, according to the available data) and Abstracts Views on Vision4Press platform.
Data correspond to usage on the plateform after 2015. The current usage metrics is available 48-96 hours after online publication and is updated daily on week days.
Initial download of the metrics may take a while.