Open Access
Fig. G.1
Download original image
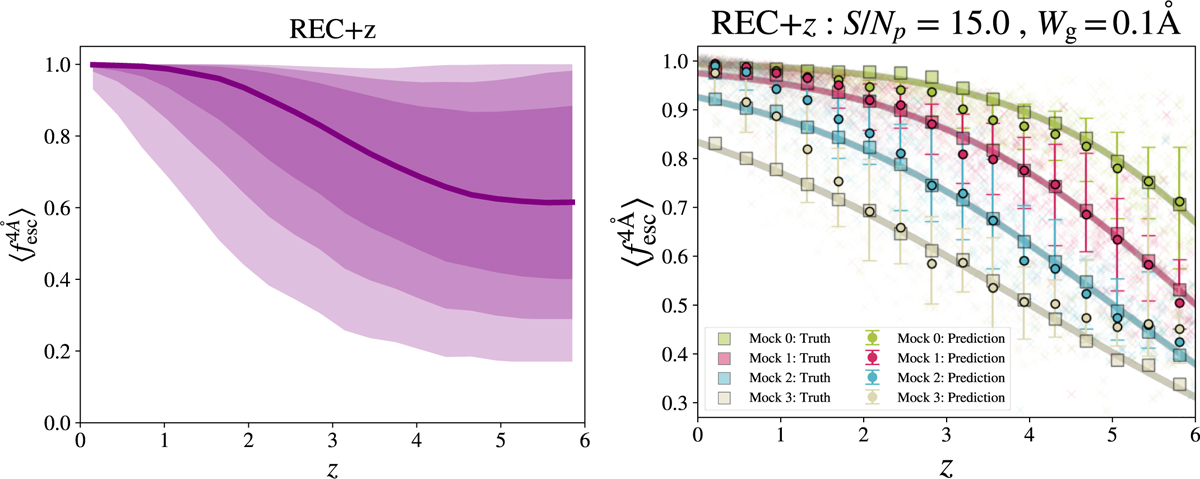
Left: ![]() distribution as a function of redshift in the REC+z model. The solid line shows the 50 percentile, while, from darker to lighter, the shadows show the 1σ, 2σ and 3σ. Right: Same as as Fig. 6 but for REC+z at S/Np = 15.0 and Win = 0.1 Å.
distribution as a function of redshift in the REC+z model. The solid line shows the 50 percentile, while, from darker to lighter, the shadows show the 1σ, 2σ and 3σ. Right: Same as as Fig. 6 but for REC+z at S/Np = 15.0 and Win = 0.1 Å.
Current usage metrics show cumulative count of Article Views (full-text article views including HTML views, PDF and ePub downloads, according to the available data) and Abstracts Views on Vision4Press platform.
Data correspond to usage on the plateform after 2015. The current usage metrics is available 48-96 hours after online publication and is updated daily on week days.
Initial download of the metrics may take a while.