Fig. 1
Download original image
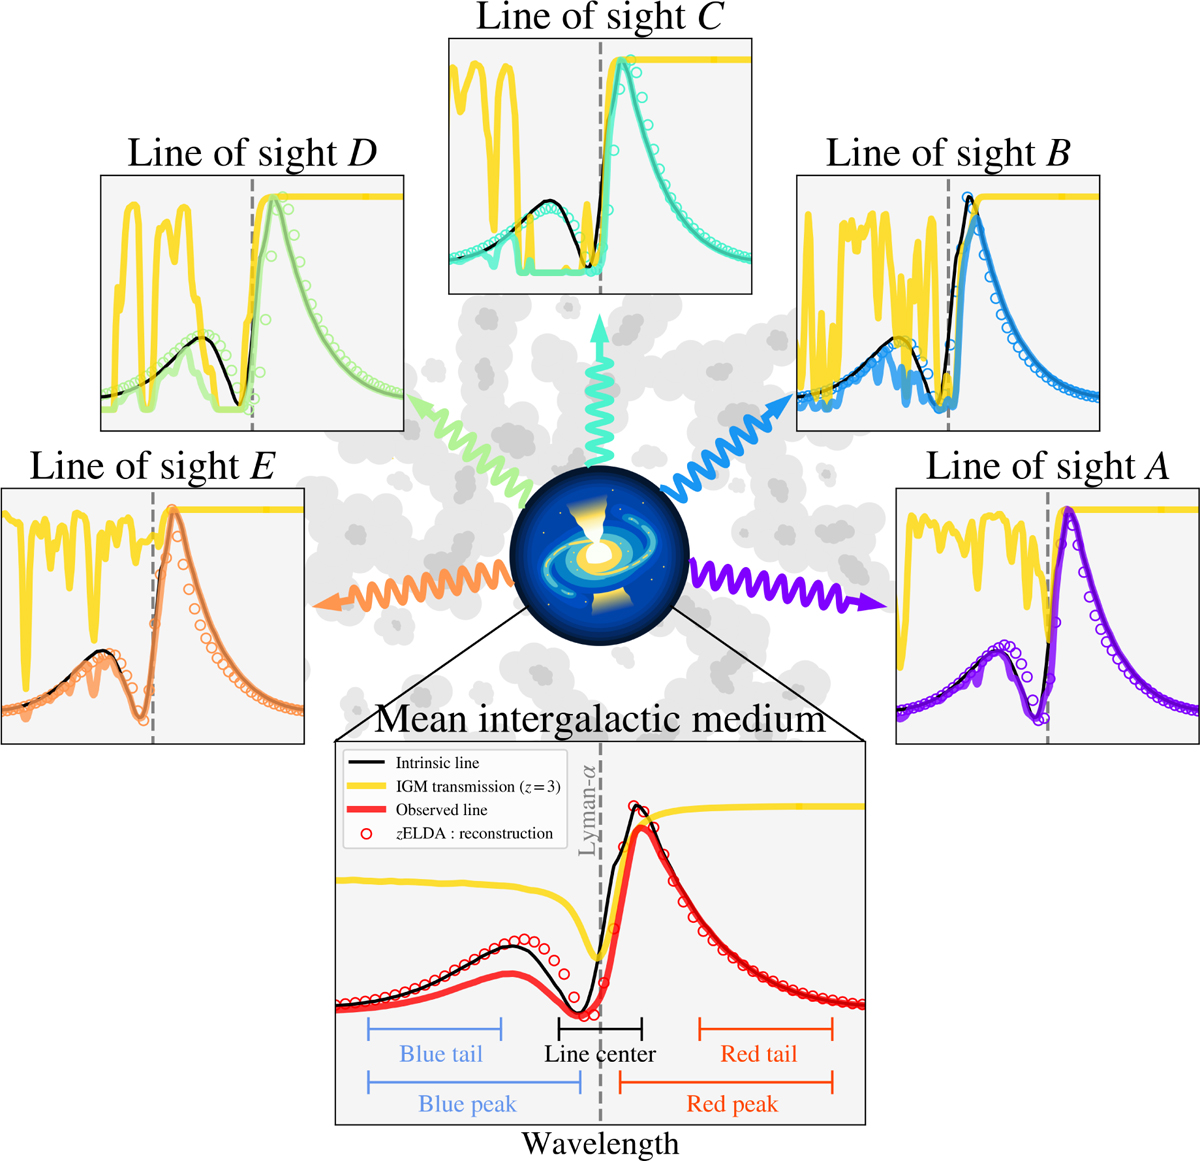
Illustration of impact of different lines of sight in the same intrinsic spectrum. In the middle bottom panel, we show the intrinsic spectrum escaping the source (black) convolved with the mean IGM transmission at z = 3.0 (yellow). The colour line shows the convolution of the intrinsic spectrum and IGM transmission. The coloured circles show the zELDA reconstruction using the IGM-z model (discussed later). In the other five top panels, individual IGM transmission through different lines of sight are used at z = 3.0.
Current usage metrics show cumulative count of Article Views (full-text article views including HTML views, PDF and ePub downloads, according to the available data) and Abstracts Views on Vision4Press platform.
Data correspond to usage on the plateform after 2015. The current usage metrics is available 48-96 hours after online publication and is updated daily on week days.
Initial download of the metrics may take a while.