Fig. 5.
Download original image
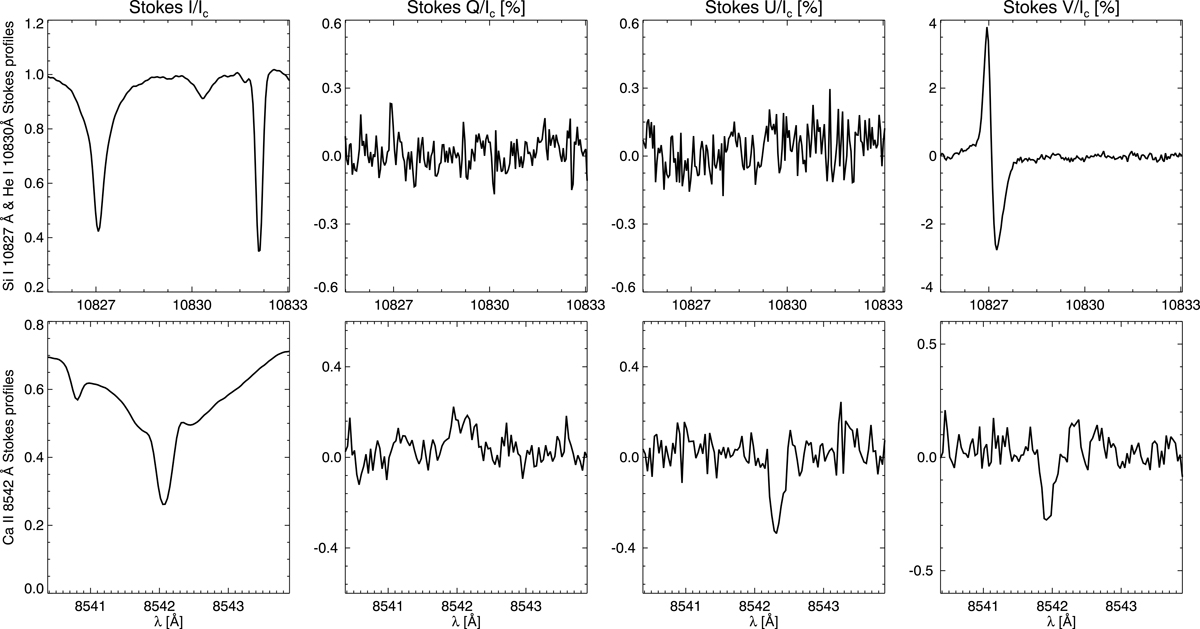
Intensity (first column), Stokes Q (second column), U (third column), and V (fourth column) profiles, normalised to the average quiet-Sun continuum intensity, Ic. The top row shows the spectra in channel 1, which includes the Si I line at 10827 Å and the He I triplet at 10830 Å. The bottom row shows the spectra in channel 2, which includes most of the Ca II line at 8542 Å. The displayed profiles correspond to the pixel at (33, 57) arcsec, the orange square in Fig. 2, which is associated with a quiet-Sun area with low magnetic activity.
Current usage metrics show cumulative count of Article Views (full-text article views including HTML views, PDF and ePub downloads, according to the available data) and Abstracts Views on Vision4Press platform.
Data correspond to usage on the plateform after 2015. The current usage metrics is available 48-96 hours after online publication and is updated daily on week days.
Initial download of the metrics may take a while.