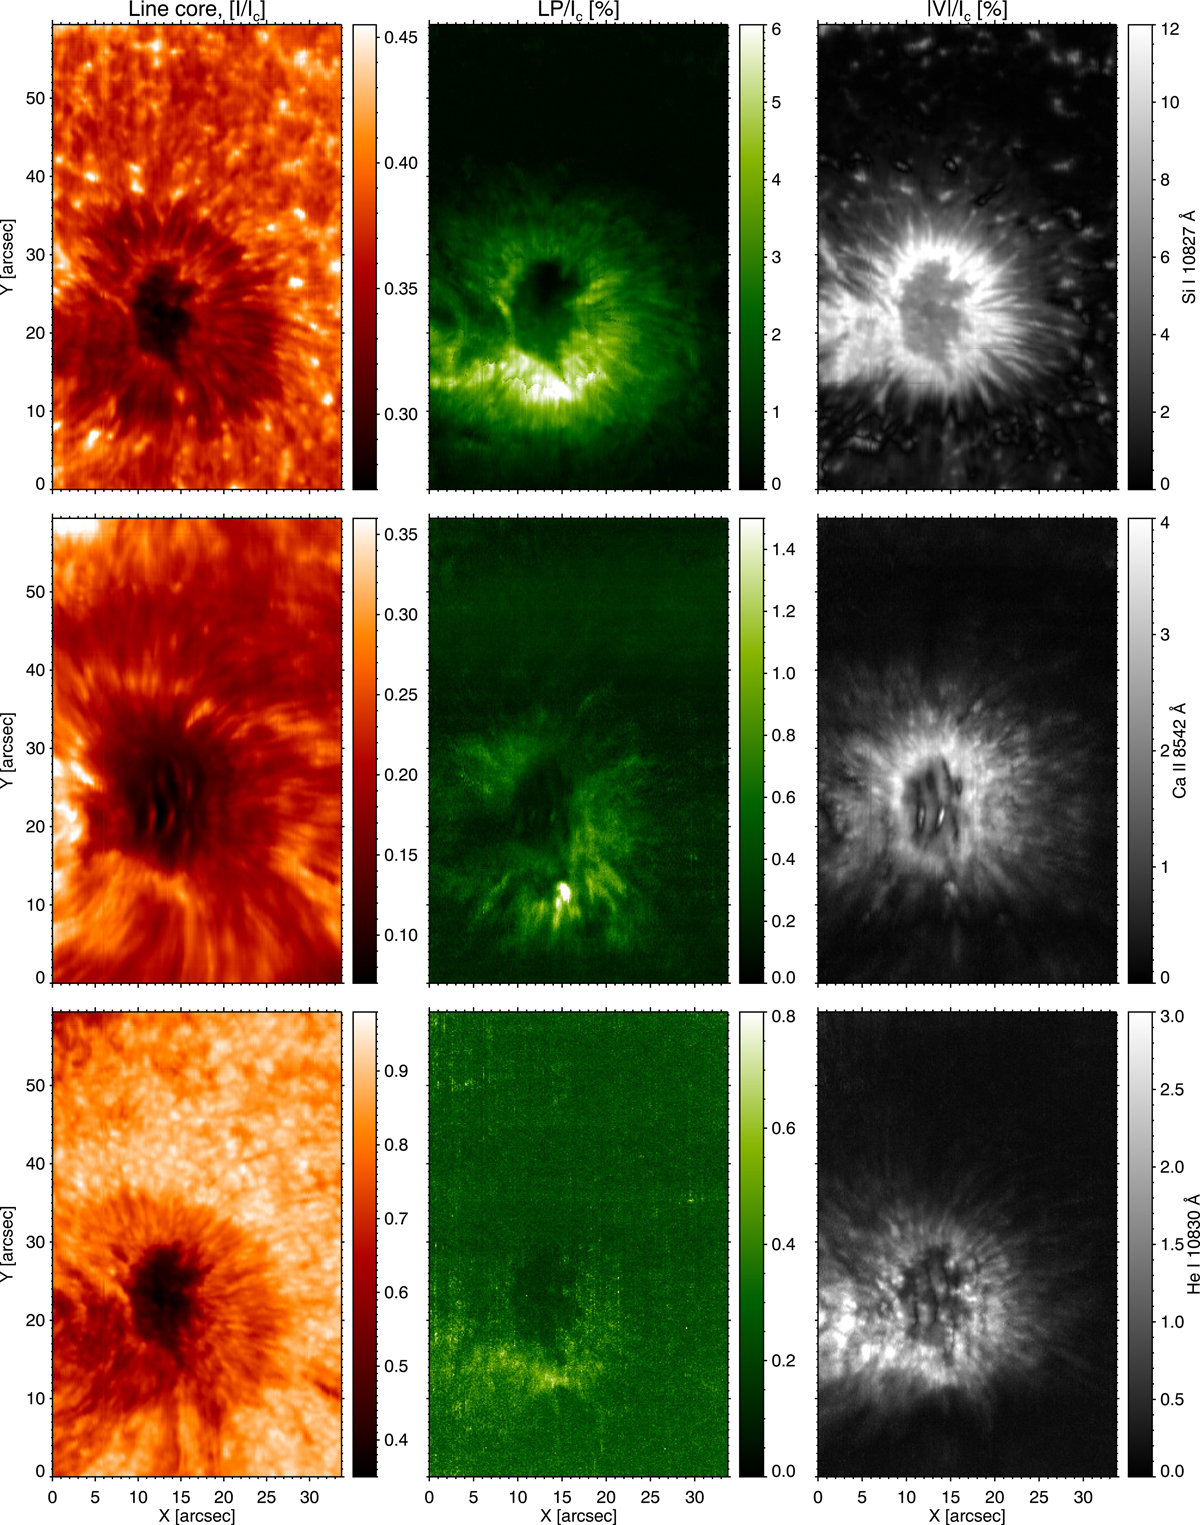
Fig. 4.
Download original image
Spatial distribution of the line core intensity (left column), maximum linear polarisation (central column), and maximum circular polarisation in absolute values (right column) for the Si I line at 10827 Å (top row), the Ca II line at 8542 Å (middle row), and the He I triplet at 10830 Å (bottom row). All quantities are normalised to the average quiet-Sun continuum intensity, Ic.
Current usage metrics show cumulative count of Article Views (full-text article views including HTML views, PDF and ePub downloads, according to the available data) and Abstracts Views on Vision4Press platform.
Data correspond to usage on the plateform after 2015. The current usage metrics is available 48-96 hours after online publication and is updated daily on week days.
Initial download of the metrics may take a while.