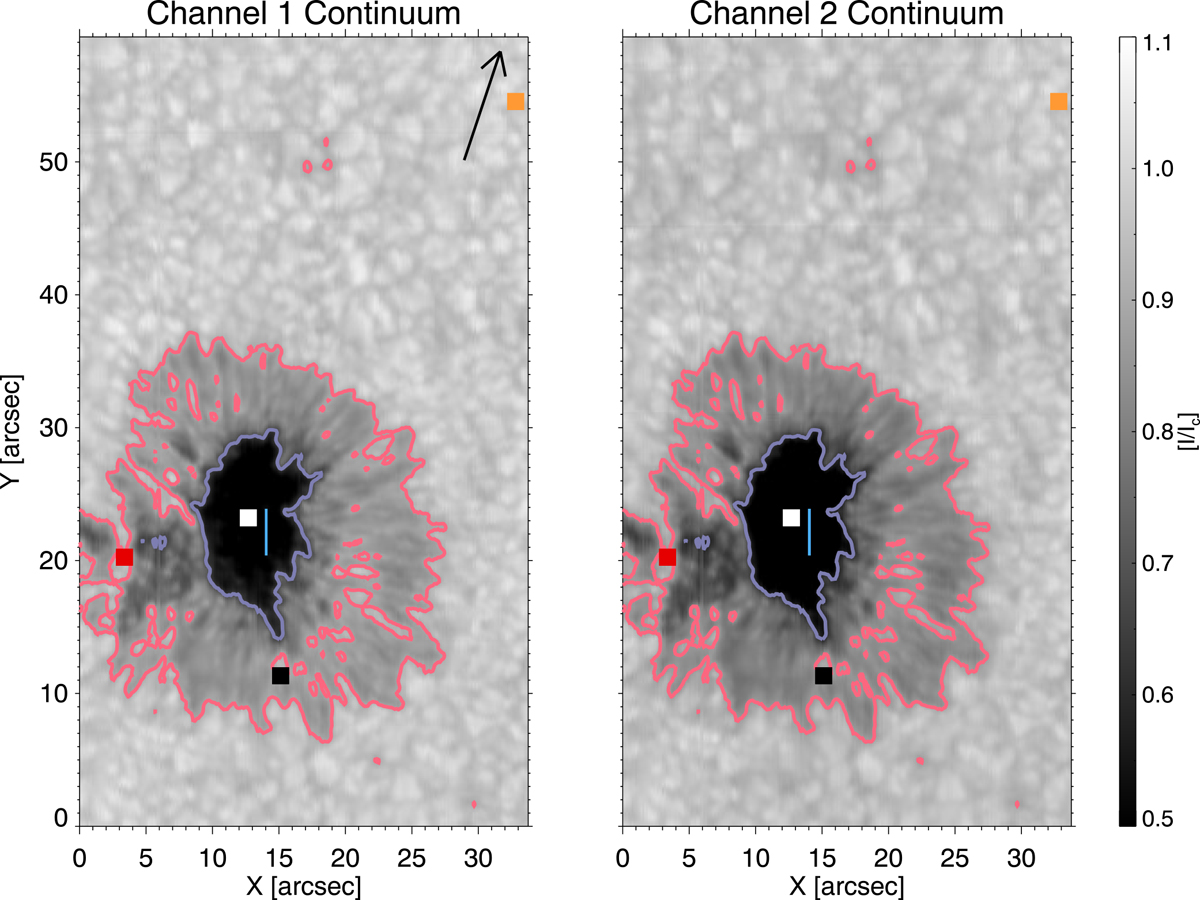
Fig. 2.
Download original image
Spatial distribution of the continuum intensity normalised to the averaged continuum intensity over a quiet-Sun area located at the top of the observed FOV, Ic. The panels represent the recorded intensity in channels 1 (left panel) and 2 (right panel) of GRIS. The long-slit scan was performed from the left to the right side of the image. The vertical axis corresponds to the north-south direction of the Sun. The coloured symbols highlight regions of interest studied in Section 3. At the same time, the contours tentatively underline the location of the umbra (defined as regions with Ic∼0.6) and penumbra (areas where Ic∼0.8). The arrow in the left panel points towards the disc centre.
Current usage metrics show cumulative count of Article Views (full-text article views including HTML views, PDF and ePub downloads, according to the available data) and Abstracts Views on Vision4Press platform.
Data correspond to usage on the plateform after 2015. The current usage metrics is available 48-96 hours after online publication and is updated daily on week days.
Initial download of the metrics may take a while.