Open Access
Fig. 13.
Download original image
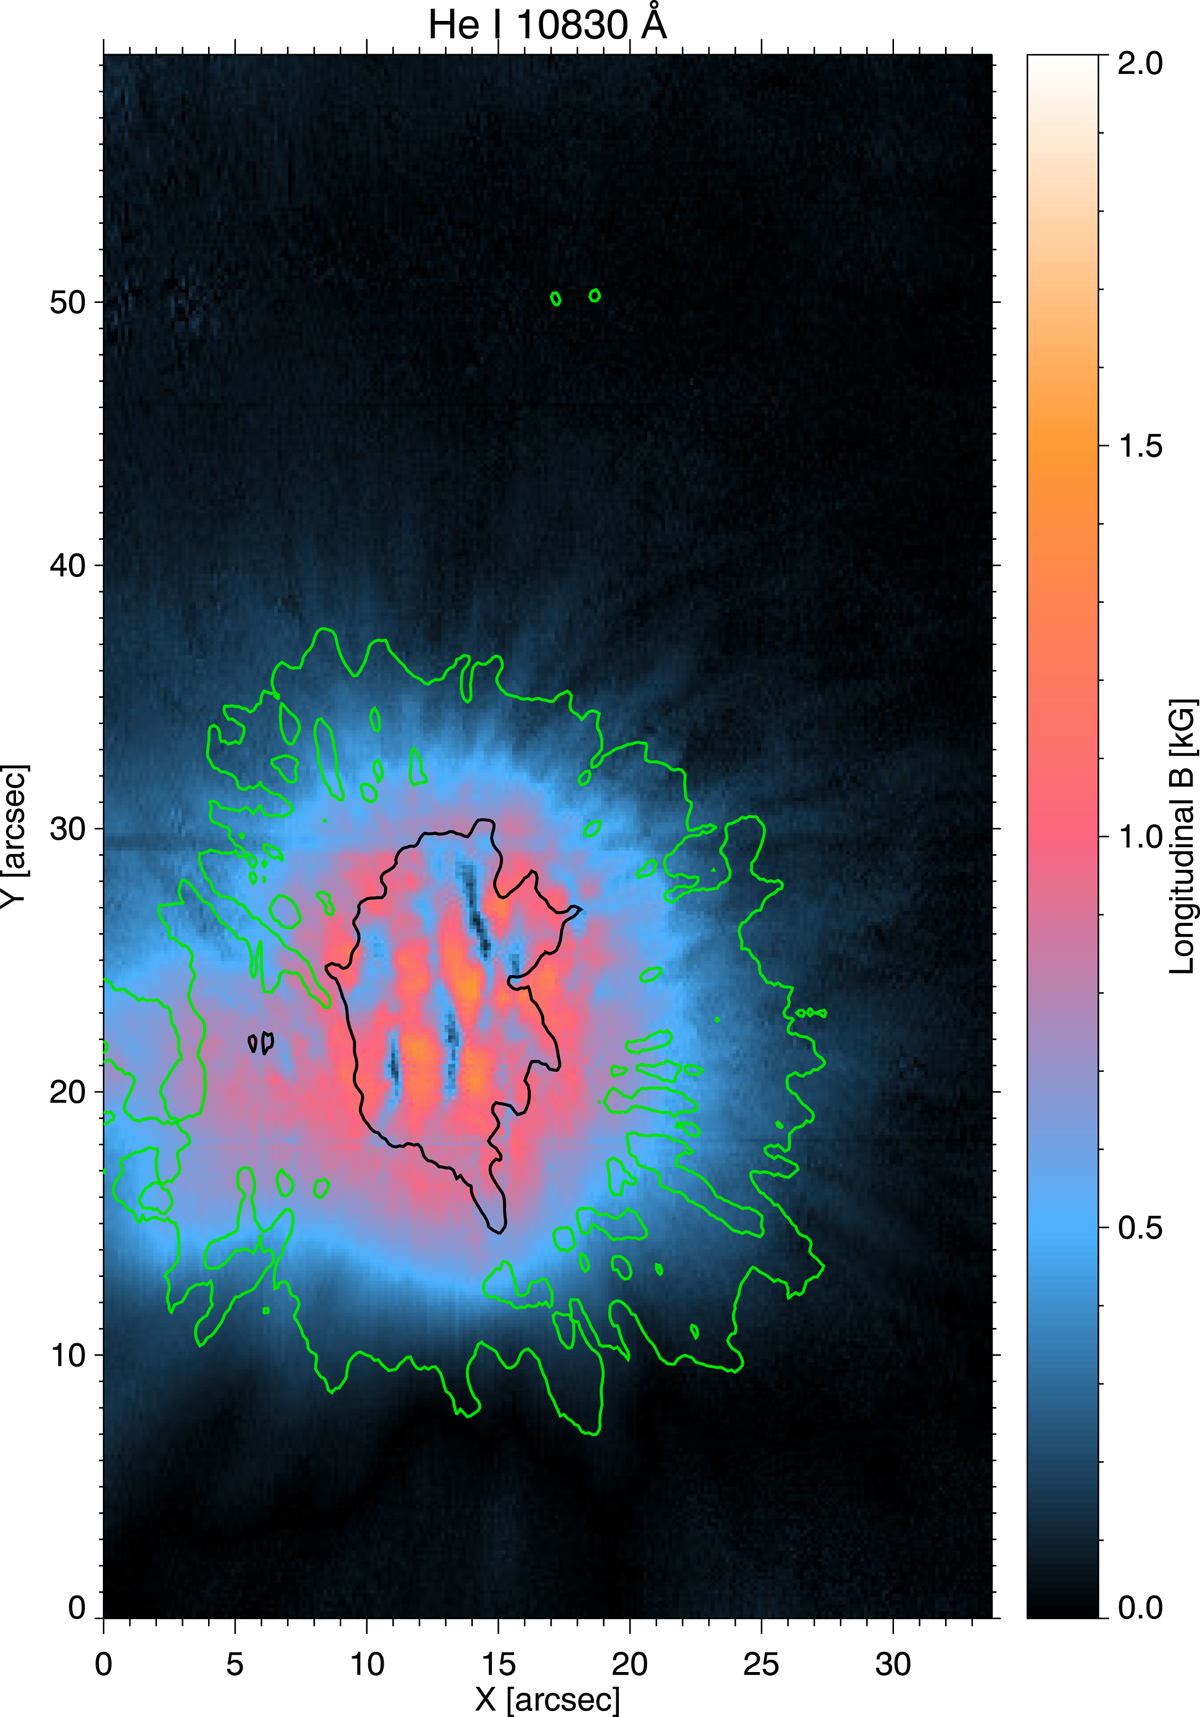
Spatial distribution of the longitudinal component of the magnetic field inferred from the application of the WFA to the He I line. The contours tentatively define the area corresponding to the umbra and penumbra computed from the continuum intensity maps presented in Figure 2.
Current usage metrics show cumulative count of Article Views (full-text article views including HTML views, PDF and ePub downloads, according to the available data) and Abstracts Views on Vision4Press platform.
Data correspond to usage on the plateform after 2015. The current usage metrics is available 48-96 hours after online publication and is updated daily on week days.
Initial download of the metrics may take a while.