Fig. 12.
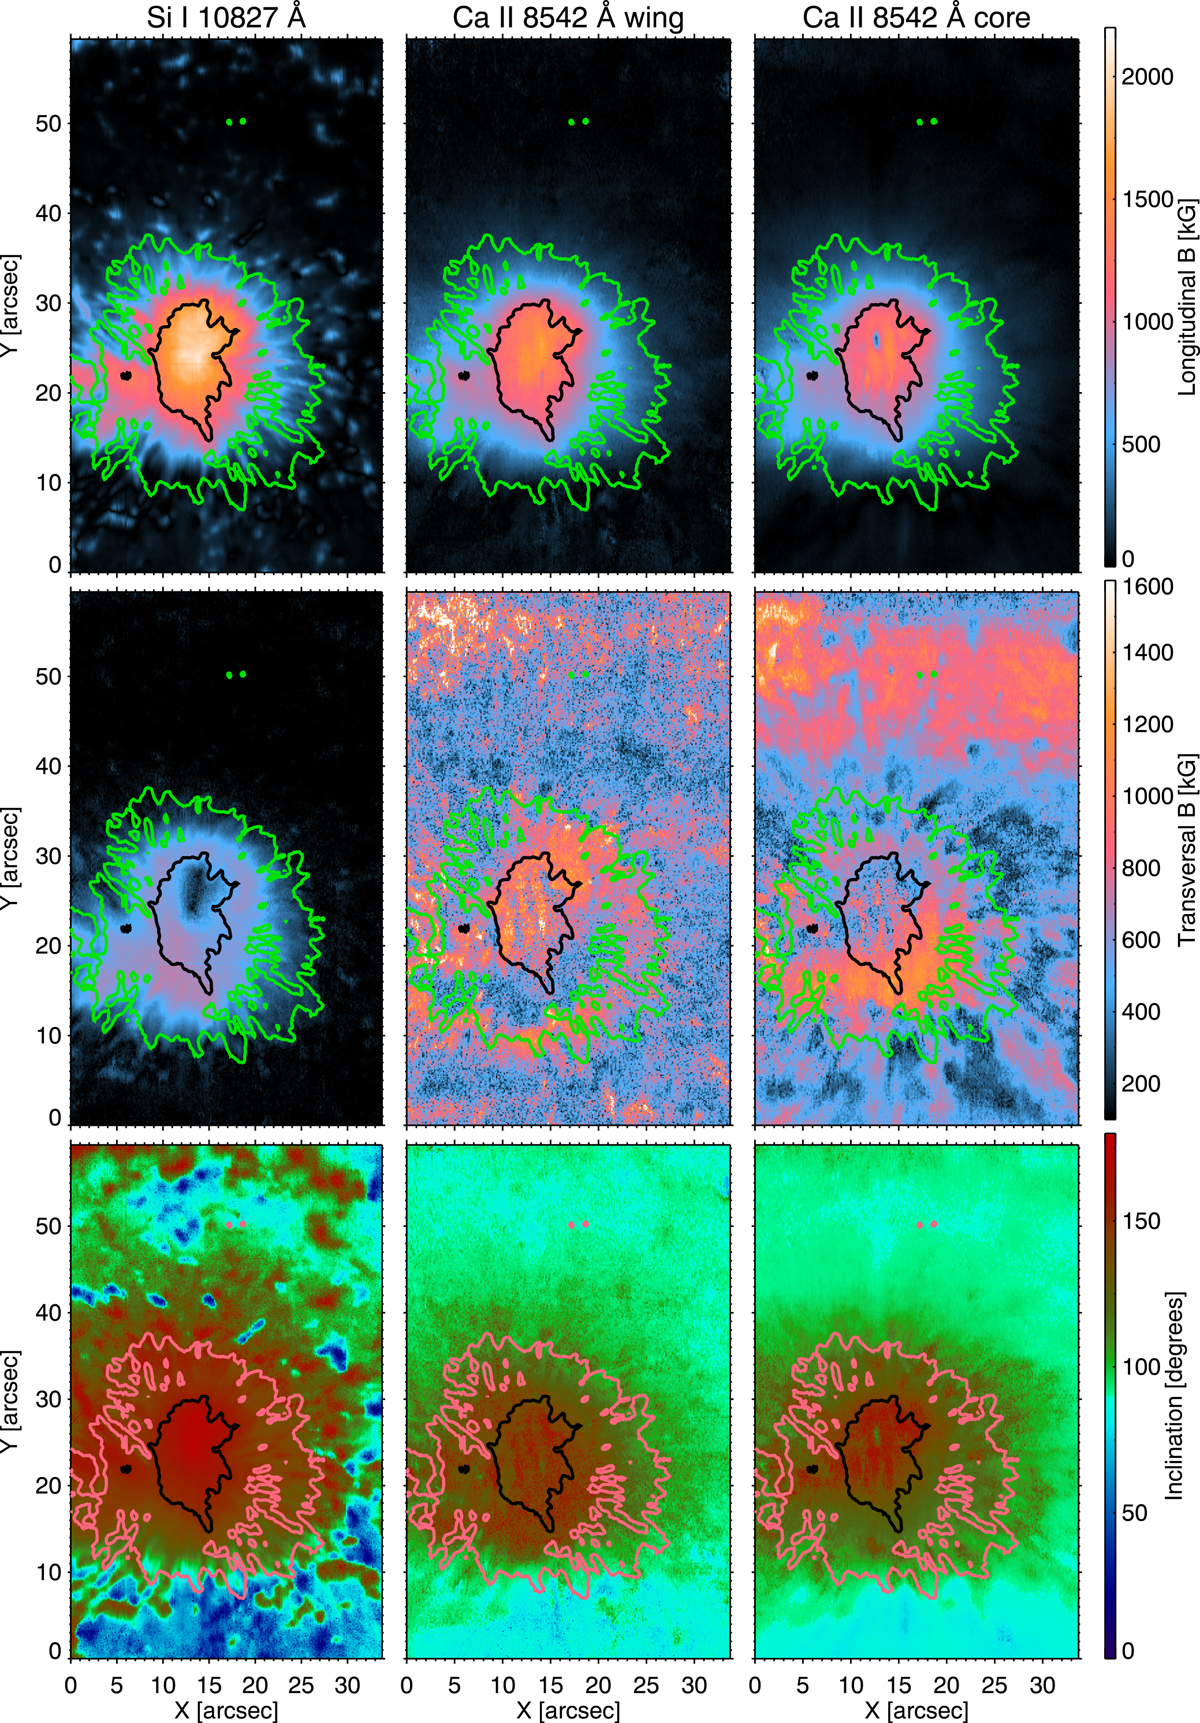
Download original image
Spatial distribution of the longitudinal (top row) and transverse (middle row) components of the magnetic field inferred from the WFA on the Si I line (first column) and on the Ca II line wing (second column) and line centre (third column). The bottom row shows the inclination of the magnetic field obtained by applying Eq. (8a) to the WFA results. The wavelength ranges we considered in the calculations are indicated in the text. The contours tentatively define the area corresponding to the umbra and penumbra computed from the continuum intensity maps presented in Figure 2.
Current usage metrics show cumulative count of Article Views (full-text article views including HTML views, PDF and ePub downloads, according to the available data) and Abstracts Views on Vision4Press platform.
Data correspond to usage on the plateform after 2015. The current usage metrics is available 48-96 hours after online publication and is updated daily on week days.
Initial download of the metrics may take a while.