Fig. 10.
Download original image
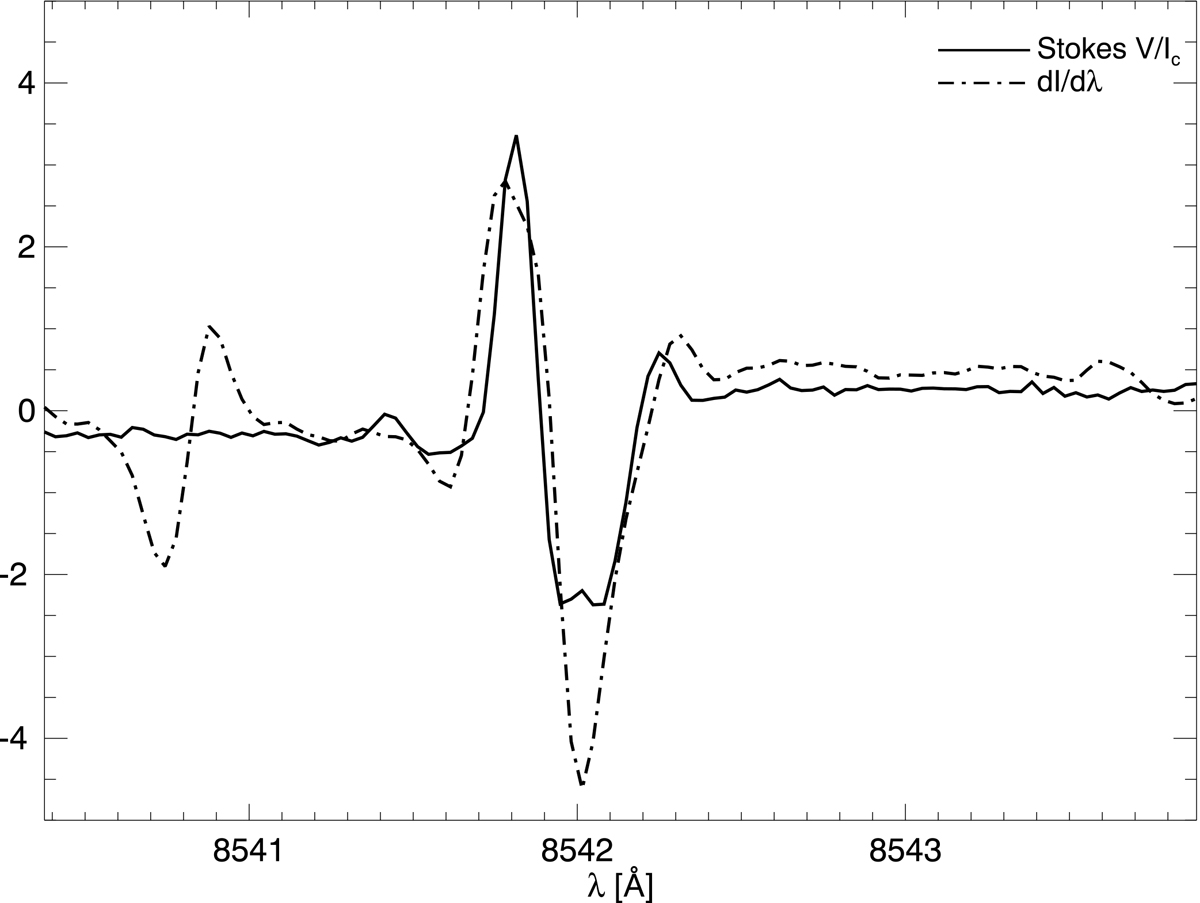
Comparison between the Stokes V profile (solid) and the derivative of Stokes I with respect to the wavelength. The Stokes profiles are normalised to the quiet-Sun averaged continuum intensity, and the representation of Stokes V is in percentage units. At the same time, we scale the derivative with an arbitrary factor to match the Stokes V amplitude. The location of this pixel is highlighted in colour in Figure 9.
Current usage metrics show cumulative count of Article Views (full-text article views including HTML views, PDF and ePub downloads, according to the available data) and Abstracts Views on Vision4Press platform.
Data correspond to usage on the plateform after 2015. The current usage metrics is available 48-96 hours after online publication and is updated daily on week days.
Initial download of the metrics may take a while.