Fig. 1.
Download original image
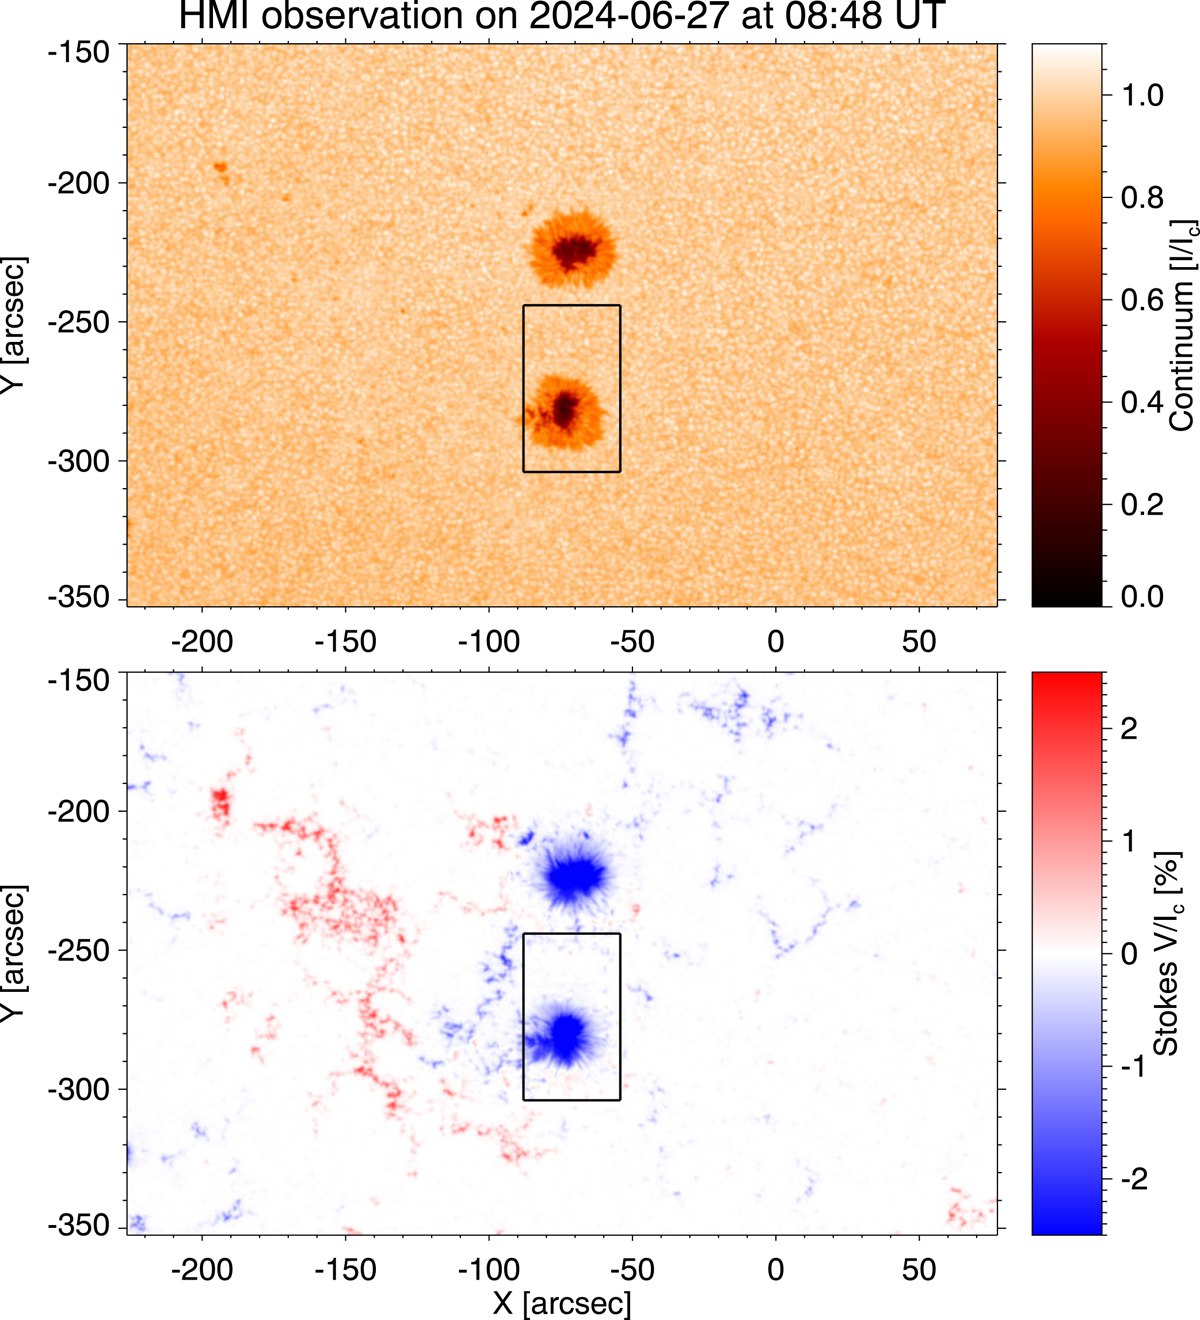
Continuum intensity map near the Fe I line at 6173 Å (top panel) and Stokes V polarity map for the same spectral line (bottom panel) acquired by the HMI/SDO on 2024 June 27 at 08:48 UT. Both quantities are normalised to the averaged continuum intensity over a quiet-Sun area at the disc centre, Ic. The black square delimits the FOV of our observations with the GRIS instrument.
Current usage metrics show cumulative count of Article Views (full-text article views including HTML views, PDF and ePub downloads, according to the available data) and Abstracts Views on Vision4Press platform.
Data correspond to usage on the plateform after 2015. The current usage metrics is available 48-96 hours after online publication and is updated daily on week days.
Initial download of the metrics may take a while.