Fig. 1.
Download original image
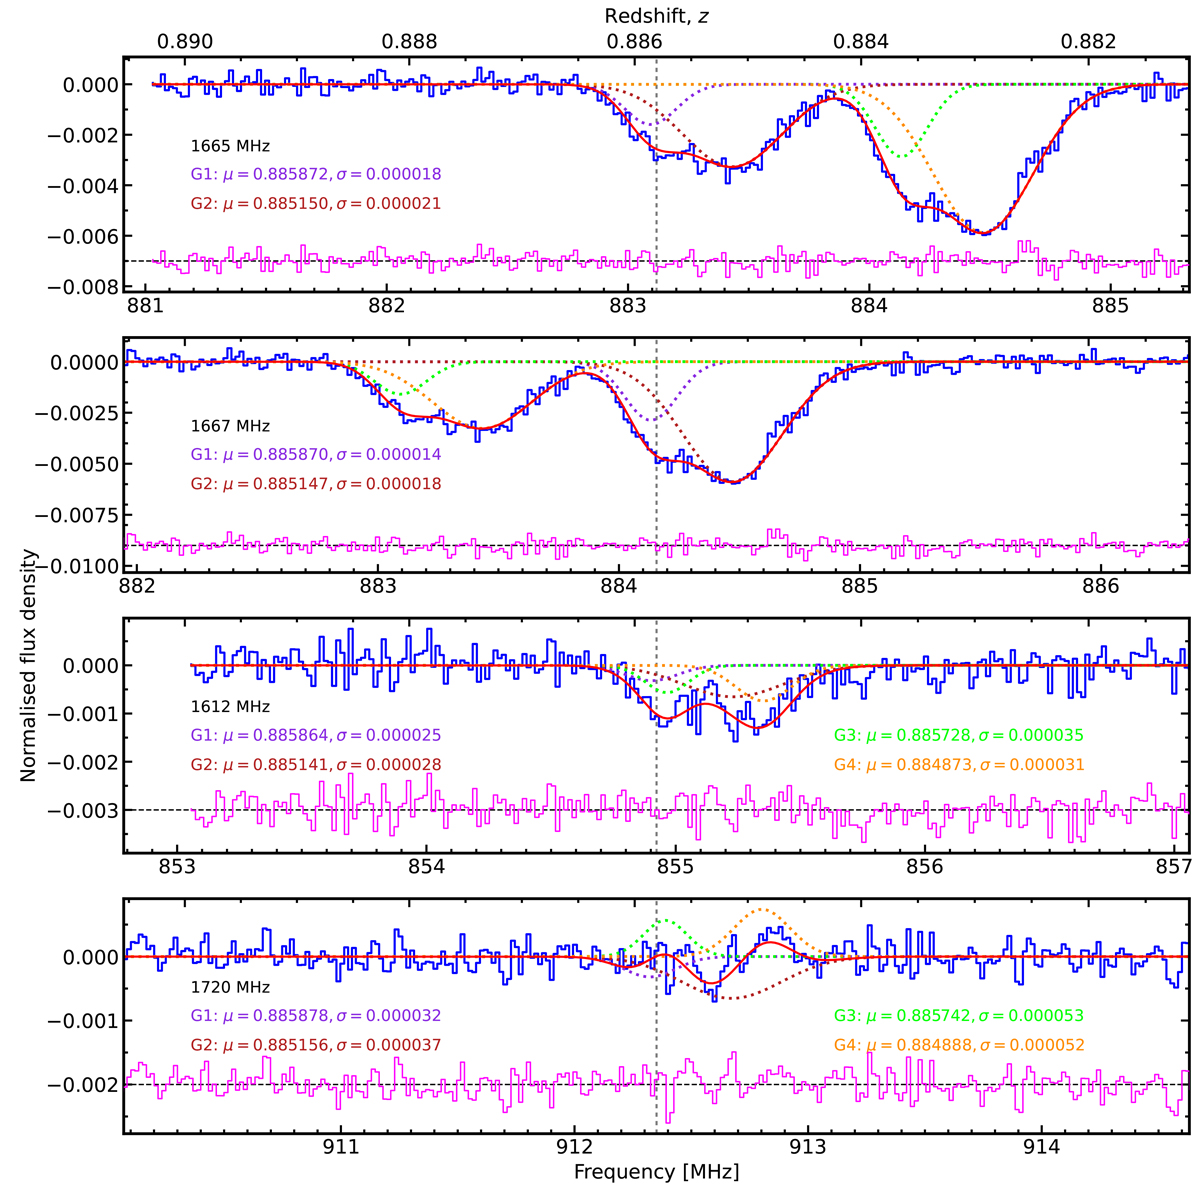
Gaussian fitting of the OH 18 cm lines. From top to bottom are the OH 1665, 1667, 1612, and 1720 MHz lines. Two Gaussian functions fitted to the OH 1667 MHz line are marked with dotted purple and magenta lines. The corresponding counterparts of these two Gaussian components in other lines in the LTE condition are also marked with dotted purple and magenta lines. The conjugate OH satellite lines (absorption in the 1612 MHz line and emission in the 1720 MHz line) are marked with green and orange. The vertical dashed gray line marks the optical redshift. In all subplots, violet lines represent residuals that have been shifted in the Y axis for clarity; the redshifts and their associated uncertainties of individual components are denoted with μ and σ.
Current usage metrics show cumulative count of Article Views (full-text article views including HTML views, PDF and ePub downloads, according to the available data) and Abstracts Views on Vision4Press platform.
Data correspond to usage on the plateform after 2015. The current usage metrics is available 48-96 hours after online publication and is updated daily on week days.
Initial download of the metrics may take a while.