Open Access
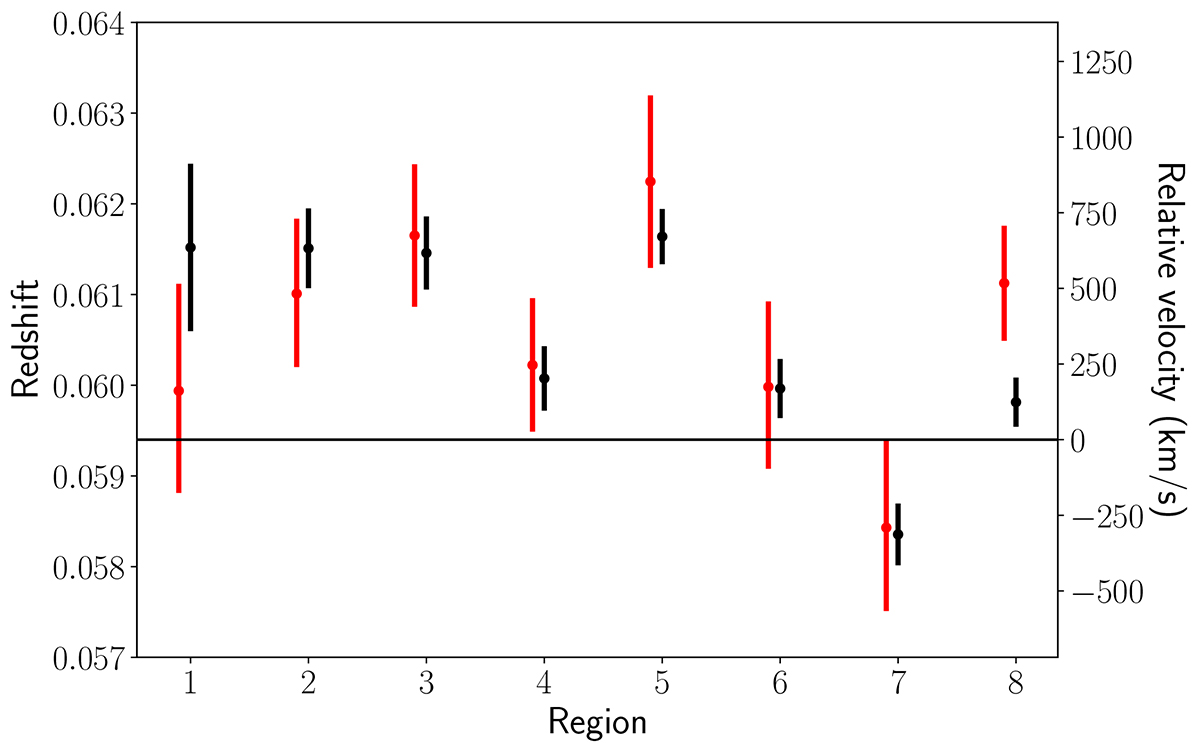
Fig. 5.
Download original image
Comparison between the velocities obtained for each Region (black points) and those obtained by Gatuzz et al. (2024, red points). The horizontal line indicates the A3266 cluster redshift (z = 0.0594).
Current usage metrics show cumulative count of Article Views (full-text article views including HTML views, PDF and ePub downloads, according to the available data) and Abstracts Views on Vision4Press platform.
Data correspond to usage on the plateform after 2015. The current usage metrics is available 48-96 hours after online publication and is updated daily on week days.
Initial download of the metrics may take a while.