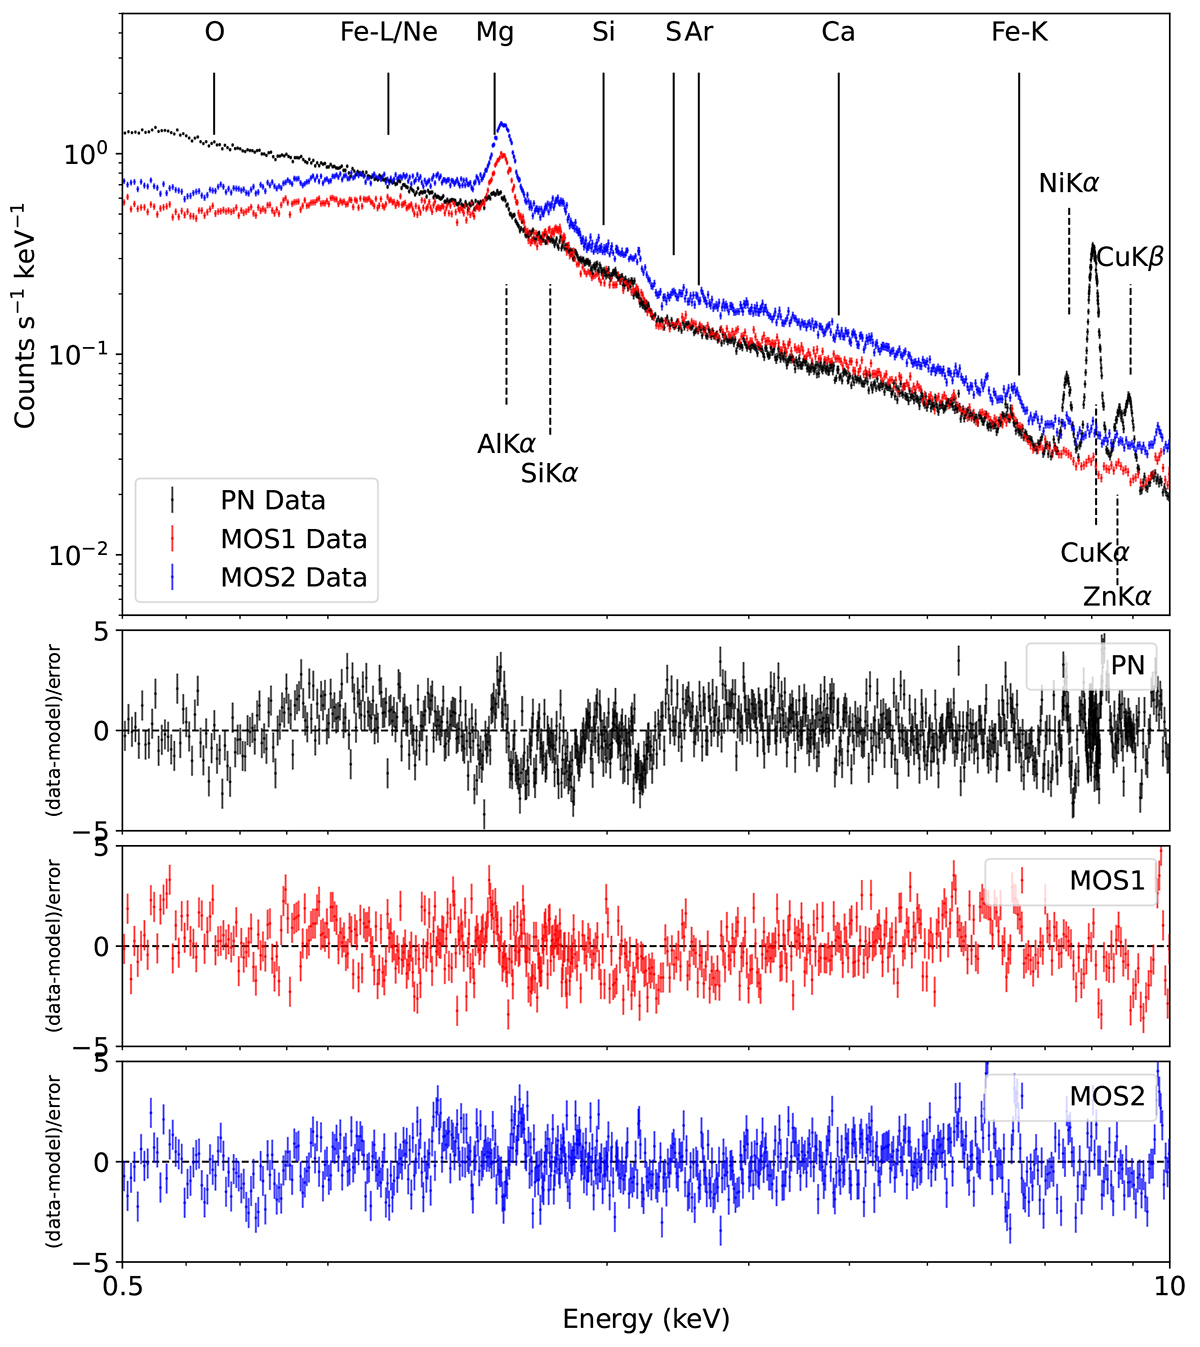
Fig. 2.
Download original image
Example spectrum and best-fit model obtained from the global fit for Region 2. The spectrum has been rebinned for illustrative purposes. EPIC-pn (black points), MOS1 (red points), and MOS2 (blue points) have been included. The line contribution from instrumental background (vertical dashed lines) and ICM emission (vertical solid lines) are indicated. The lower panel shows the residuals of the fit for each instrument.
Current usage metrics show cumulative count of Article Views (full-text article views including HTML views, PDF and ePub downloads, according to the available data) and Abstracts Views on Vision4Press platform.
Data correspond to usage on the plateform after 2015. The current usage metrics is available 48-96 hours after online publication and is updated daily on week days.
Initial download of the metrics may take a while.