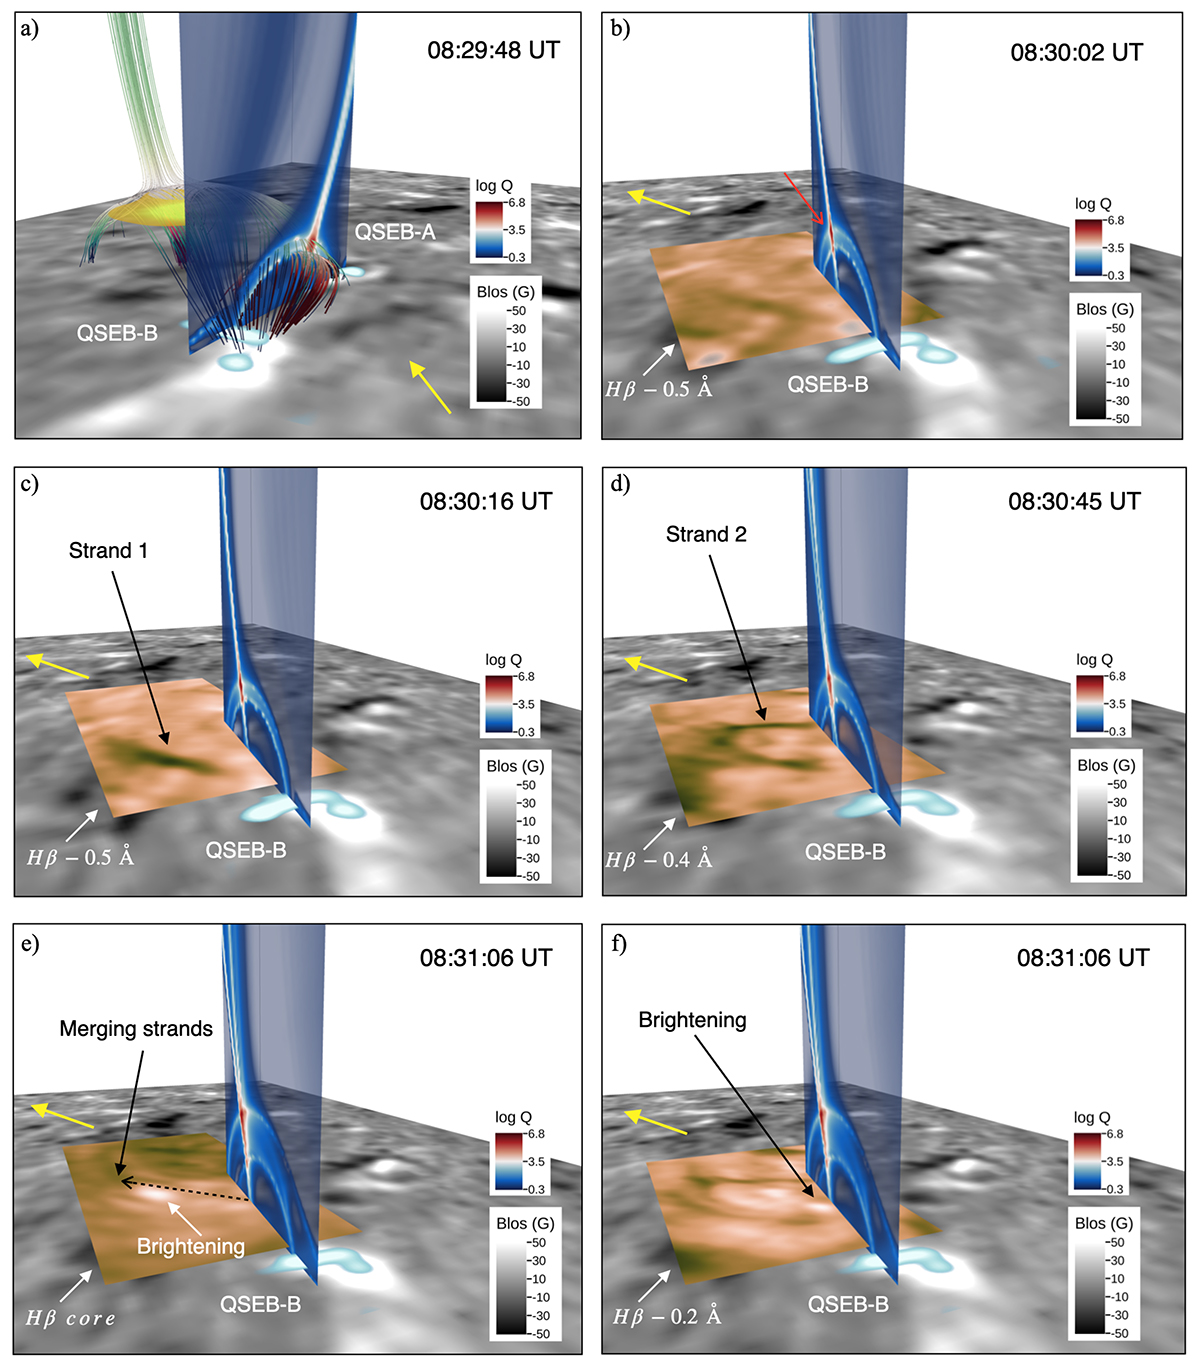
Fig. 5.
Download original image
Stages of the inverted-Y-shaped jet along with the logarithm of the squashing factor (log Q), at different instances. In all panels, the grey-scale image at the bottom is the BLOS map, while the yellow arrow points to the north limb. Panel (a) shows the magnetic field lines associated with the two 3D nulls, along with the UV brightening in yellow close to the outer 3D null and the QSEBs at the fan surface footpoints. The magnetic field lines are not shown in other panels to avoid clutter. All panels include log Q slices, where red indicates high Q values. The red arrow in panel (b) points to the region with the highest value along a vertical high Q line, where reconnection likely occurs. A brown layer in panels (b)–(f) shows the Hβ image at different wavelengths, which depict the various features of the inverted-Y-shaped jet. The dashed black arrow in panel (e) marks the distance between the vertical high Q line and the merging strands (1.2 Mm).
Current usage metrics show cumulative count of Article Views (full-text article views including HTML views, PDF and ePub downloads, according to the available data) and Abstracts Views on Vision4Press platform.
Data correspond to usage on the plateform after 2015. The current usage metrics is available 48-96 hours after online publication and is updated daily on week days.
Initial download of the metrics may take a while.