Fig. 3.
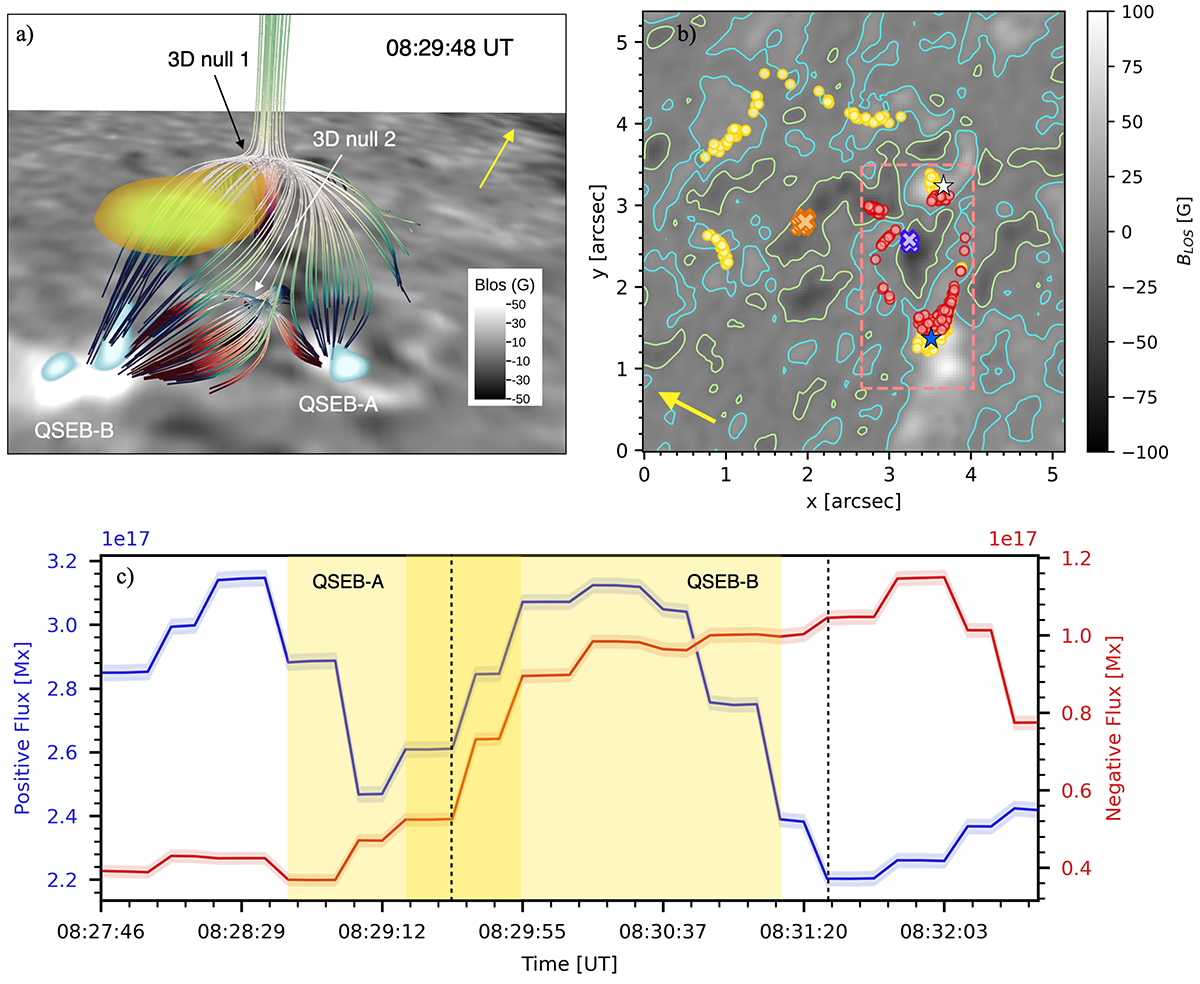
Download original image
Magnetic field topology of a smaller fan-spine structure inside a bigger fan-spine structure. Panel (a) shows the nested topology with the UV brightening in yellow colour located close to the 3D null point associated with the bigger fan-spine topology. The spines of both fan-spine structures are rooted in different negative polarity patches. The QSEBs are shown in light blue and white shades in Hβ –0.6 Å image placed close to the photosphere. Two QSEBs, namely QSEB-A and QSEB-B occur at two positive polarity patches, which are the shared footpoints of both the fan surfaces. Panel (b) shows the BLOS map with contours at 1σ above the noise level with different markers: orange cross markers denote the inner spine footpoint of 3D null 1 and yellow circles denote the footpoints of its fan surface. The blue crosses denote the position of the inner spine footpoint of 3D null 2, and the red circles show the footpoints of its fan surface. The red circles on the shared negative polarity denote the outer spine footpoint of the 3D null 2 (around x, y = 3″, 3″). The location of QSEB-A is marked with a white star, while the location of QSEB-B is marked with a blue star. The dashed pink rectangle shows the area used for calculating the magnetic flux shown in panel (c). The yellow arrows in the top panels show the direction towards the north limb. Panel (c) shows the variation of a positive and negative magnetic flux during the evolution of QSEBs and the inverted-Y-shaped jet. The error bands in positive and negative fluxes are shown as thin-shaded regions along the curves. The yellow-shaded regions denote the period of occurrence of QSEB-A and QSEB-B. The vertical dashed lines denote the start and end of the inverted-Y-shaped jet.
Current usage metrics show cumulative count of Article Views (full-text article views including HTML views, PDF and ePub downloads, according to the available data) and Abstracts Views on Vision4Press platform.
Data correspond to usage on the plateform after 2015. The current usage metrics is available 48-96 hours after online publication and is updated daily on week days.
Initial download of the metrics may take a while.