Fig. 5.
Download original image
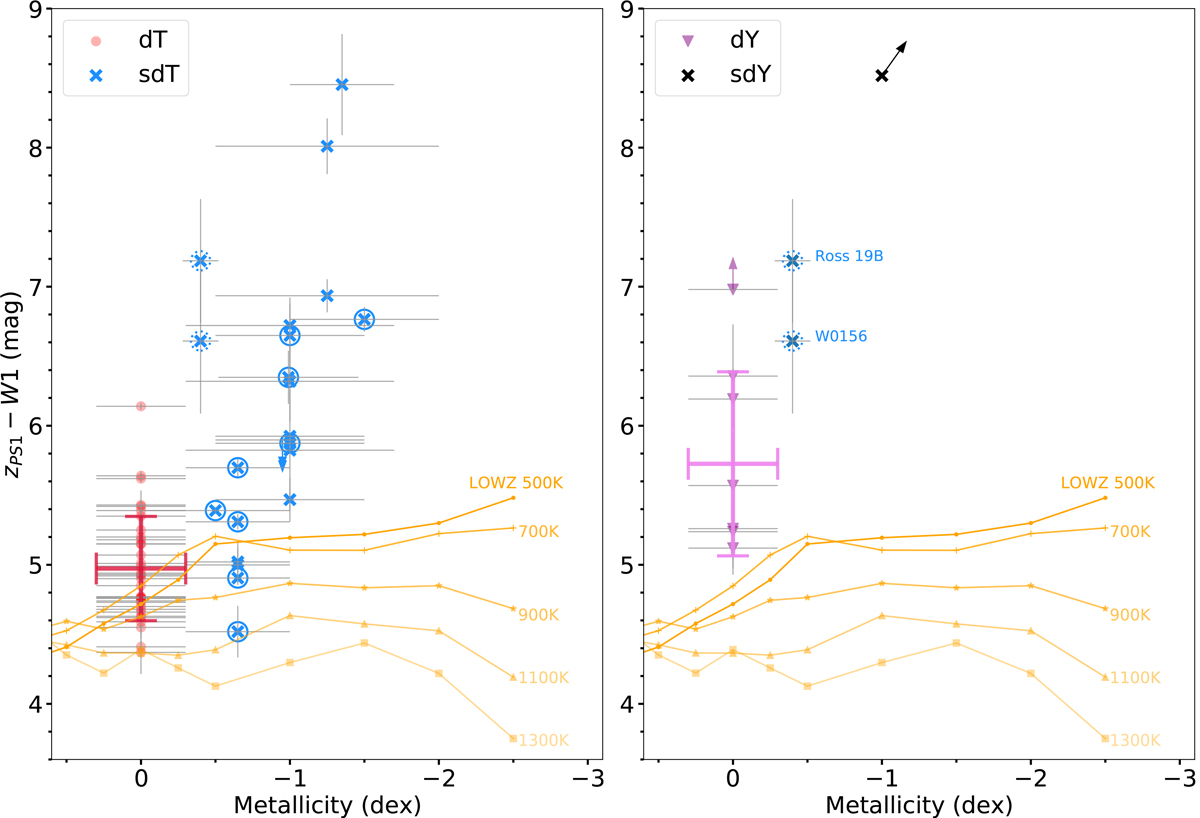
zPS1−W1 colour against metallicity for T and Y dwarfs. The vertical error bars are the photometric errors and the horizontal bars are the adopted metallicity ranges (Table 4). The blue and black crosses are metal-poor T and Y dwarf candidates, respectively. Some upper limit arrows are plotted next to the points to avoid overlapping. The solid blue circle indicates that the object has an NIR spectrum. The two very-late-type metal-poor T dwarf candidates or possible metal-poor Y dwarf candidates Ross 19B and W0156 are indicated by dotted blue circles and are plotted in both panels. The thick red and purple crosses demonstrate the average zPS1−W1 value and dispersion of solar-metallicity T and Y dwarfs, respectively. Five isothermal curves from 500 K to 1300 K from LOWZ model with parameters log(g) = 5.0, log10Kzz = 2, C/O ratio of 0.55 are shown in orange.
Current usage metrics show cumulative count of Article Views (full-text article views including HTML views, PDF and ePub downloads, according to the available data) and Abstracts Views on Vision4Press platform.
Data correspond to usage on the plateform after 2015. The current usage metrics is available 48-96 hours after online publication and is updated daily on week days.
Initial download of the metrics may take a while.