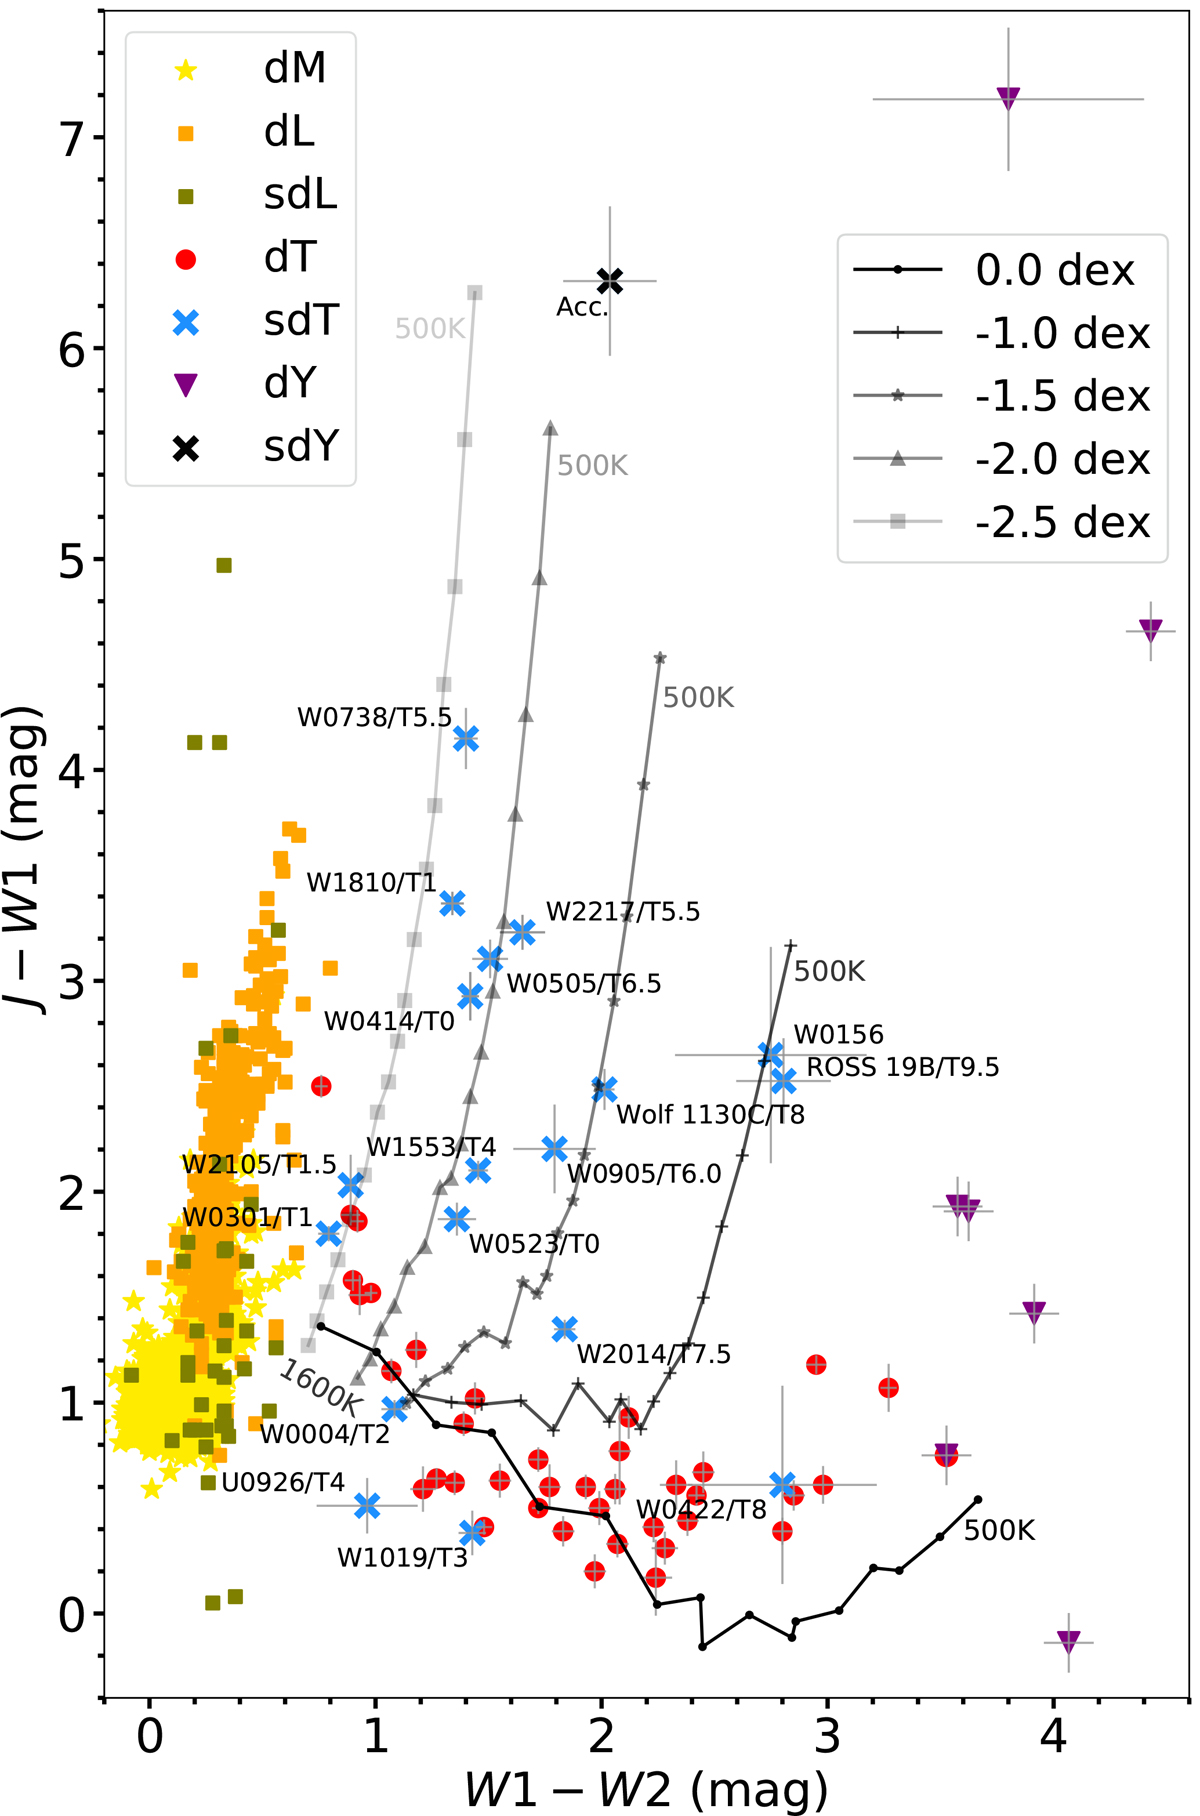
Fig. 4.
Download original image
W1−W2 vs. J−W1 colour–colour diagrams of all metal-poor T dwarf candidates (blue crosses and arrows) in Table A.1 and in Zhang et al. (2023). The Accident is shown as the black cross and arrow. We also include the solar-metallicity M, L, and T sequences from Pan-STARRS as yellow stars, orange squares, and red dots, respectively, along with L subdwarfs (olive squares), four Y0 dwarf, a Y2 dwarf, the Y4 dwarf (purple triangles), and a T9+Y0 system (red dot mixed with purple triangle). Error bars are included for all sources, except for M and L dwarfs. We also show five iso-metallicity curves from the low-metallicity theoretical model LOWZ with parameters log(g) = 5.0, log10Kzz = 2, solar C/O ratio 0.55. From left to right of the five curves, the effective temperatures of the model decrease from 1600 K to 500 K, with a step of 100 K and 50 K above and under 1000 K, respectively.
Current usage metrics show cumulative count of Article Views (full-text article views including HTML views, PDF and ePub downloads, according to the available data) and Abstracts Views on Vision4Press platform.
Data correspond to usage on the plateform after 2015. The current usage metrics is available 48-96 hours after online publication and is updated daily on week days.
Initial download of the metrics may take a while.