Open Access
Fig. E.2.
Download original image
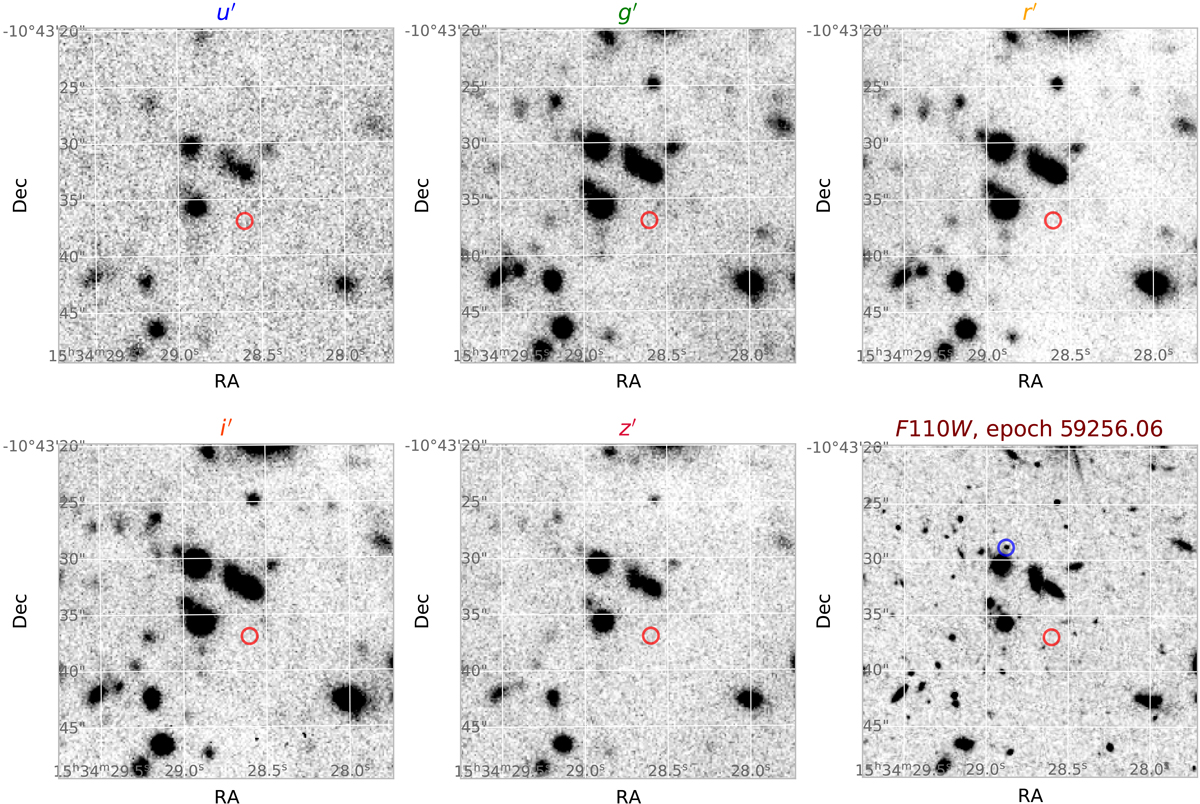
30″×30″GTC/HiPERCAM quintuple-band optical images of the Accident field with red circles indicating the expected position at the HiPERCAM epoch, compared with HST F110W image (right bottom) with blue circle indicating the Accident at the HST observation epoch. The Accident was not detected in any of the bands.
Current usage metrics show cumulative count of Article Views (full-text article views including HTML views, PDF and ePub downloads, according to the available data) and Abstracts Views on Vision4Press platform.
Data correspond to usage on the plateform after 2015. The current usage metrics is available 48-96 hours after online publication and is updated daily on week days.
Initial download of the metrics may take a while.