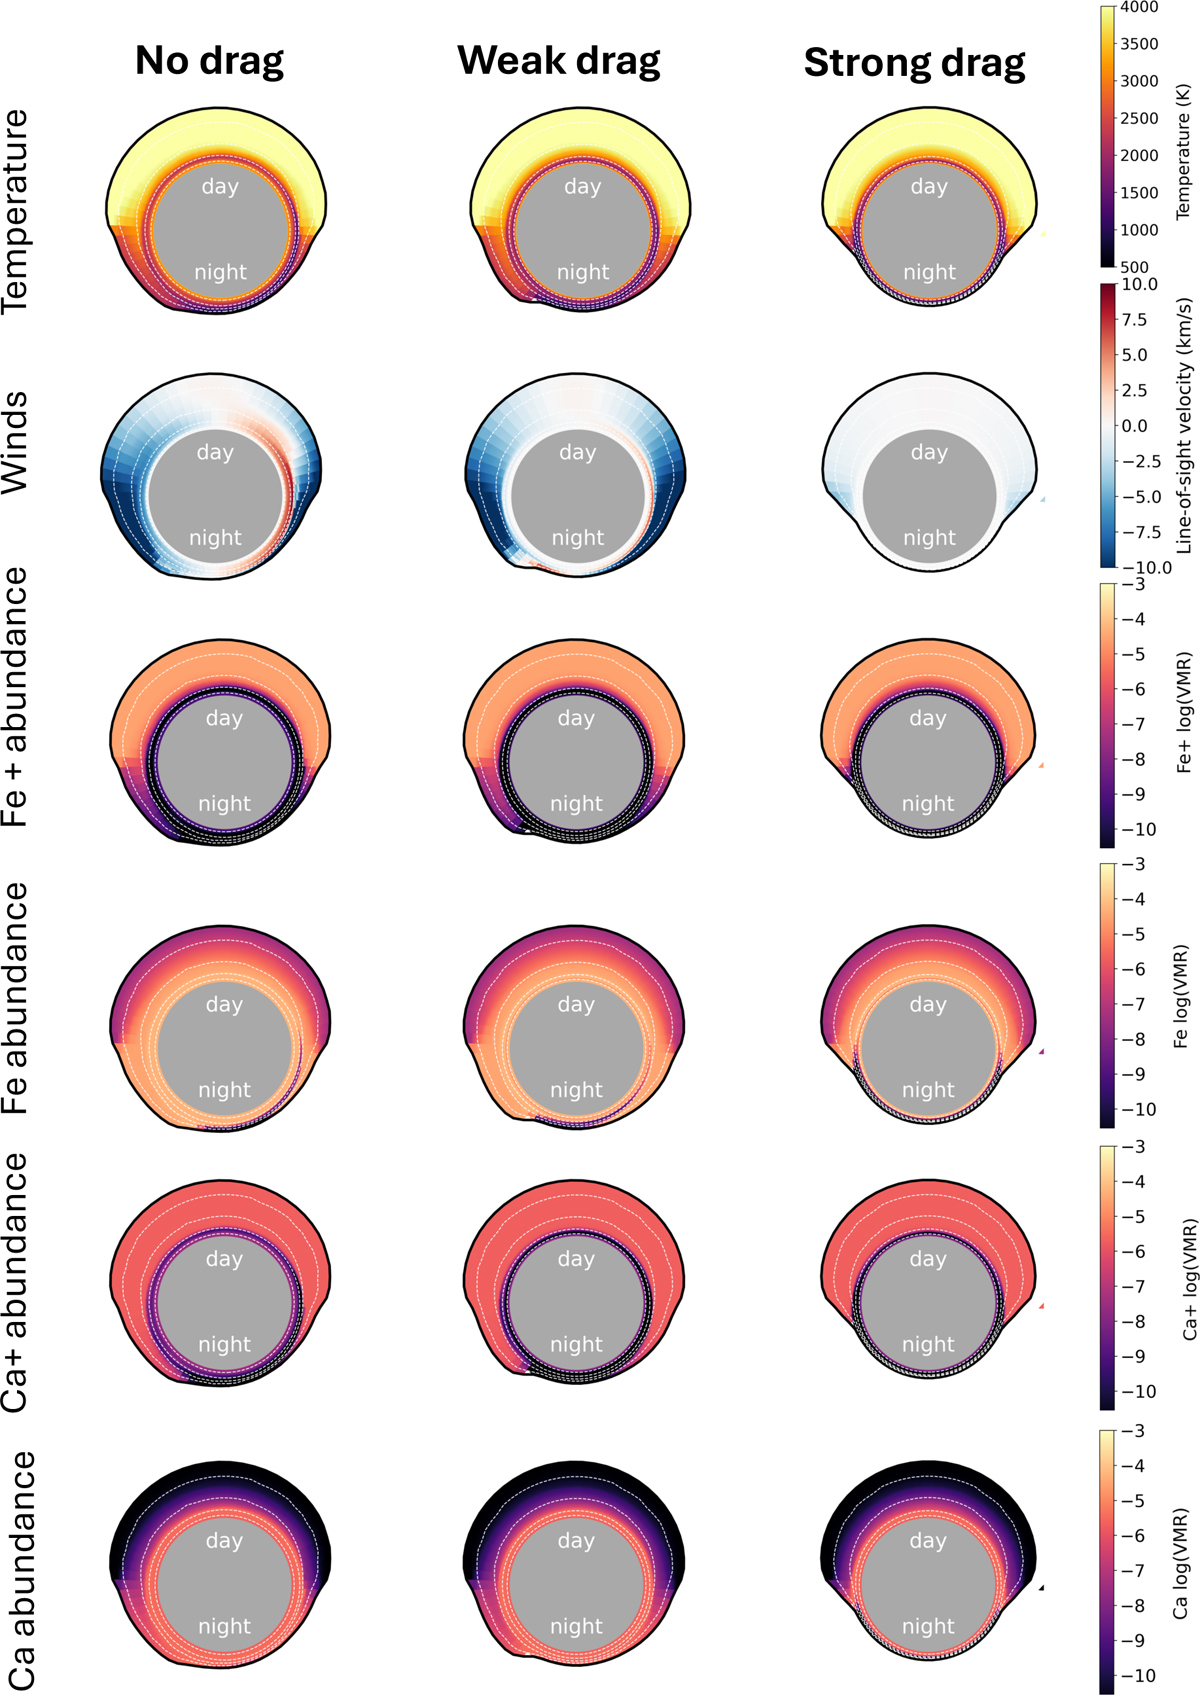
Fig. 9
Download original image
Overview of three of five GCM models of TOI-1518 b considered in this work. The model in the first column is the drag-free model, while the second and last columns consider, respectively, weak (τdrag = 106s) and strong (τdrag = 103s) drag effects. Each panel shows the planet’s equatorial plane, with the relative size of the atmosphere inflated for visualization purposes. From top to bottom, the rows show the temperature structure; the line-of-sight velocities due to winds (at mid-transit); and the spatial distribution of Fe+, Fe, Ca+, and Ca, respectively. The white dashed contours in each plot represent isobars with pressures P = 101, 10−1, 10−3, 10−5 bar.
Current usage metrics show cumulative count of Article Views (full-text article views including HTML views, PDF and ePub downloads, according to the available data) and Abstracts Views on Vision4Press platform.
Data correspond to usage on the plateform after 2015. The current usage metrics is available 48-96 hours after online publication and is updated daily on week days.
Initial download of the metrics may take a while.