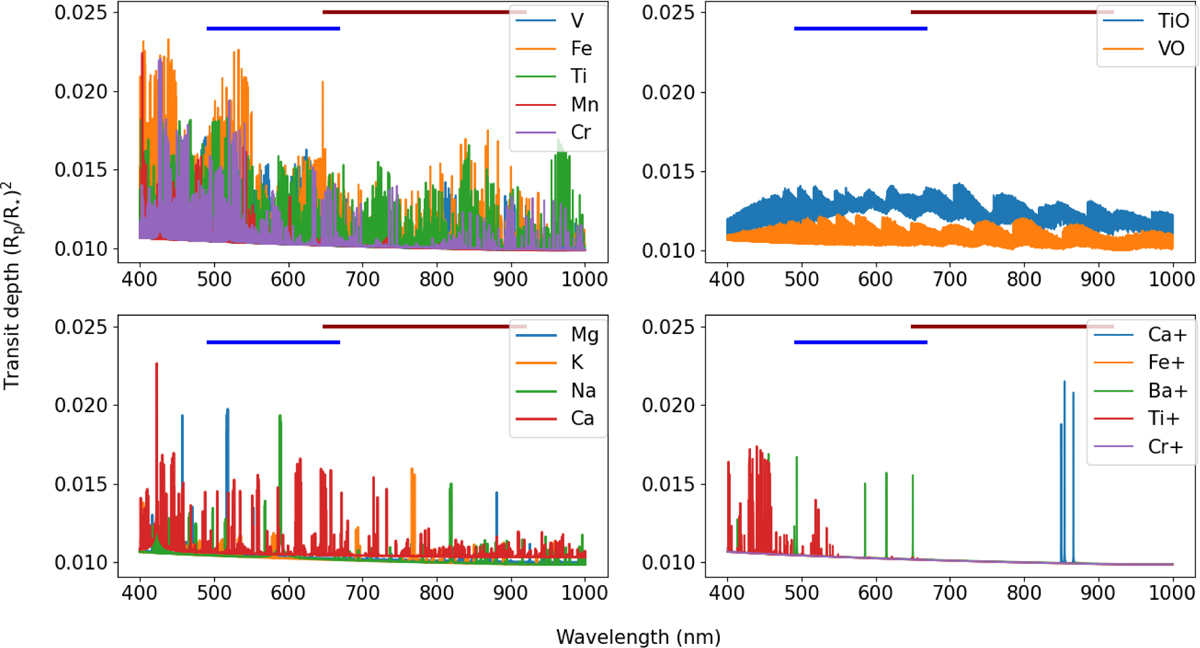
Fig. 3
Download original image
Synthetic transmission spectra computed with PetitRadtrans and FastChem used as templates for the cross-correlation analysis. They are computed for TOI-1518 b parameters, assuming a temperature of 2500 K. The wavelength coverage of MAROON-X used in this study is represented with blue (blue detector, 490–670 nm) and red (red detector, 640–920 nm) lines. Ions and alkalines have few very strong lines, while other metals are composed of line forests. Molecules also have forests of spectral lines grouped in distinct absorption bands. Except for the Ca+ lines, the other metals present strong signals in the range of the blue detector of MAROON-X, where few telluric lines are present. At 2500 K, the Fe+ and Cr+ lines are smaller than the others and are not visible in this plot.
Current usage metrics show cumulative count of Article Views (full-text article views including HTML views, PDF and ePub downloads, according to the available data) and Abstracts Views on Vision4Press platform.
Data correspond to usage on the plateform after 2015. The current usage metrics is available 48-96 hours after online publication and is updated daily on week days.
Initial download of the metrics may take a while.